Weak Financial Prospects Seem To Be Dragging Down Barnes Group Inc. (NYSE:B) Stock
With its stock down 4.7% over the past week, it is easy to disregard Barnes Group (NYSE:B). Given that stock prices are usually driven by a company’s fundamentals over the long term, which in this case look pretty weak, we decided to study the company's key financial indicators. In this article, we decided to focus on Barnes Group's ROE.
Return on equity or ROE is an important factor to be considered by a shareholder because it tells them how effectively their capital is being reinvested. In other words, it is a profitability ratio which measures the rate of return on the capital provided by the company's shareholders.
Check out our latest analysis for Barnes Group
How Is ROE Calculated?
The formula for ROE is:
Return on Equity = Net Profit (from continuing operations) ÷ Shareholders' Equity
So, based on the above formula, the ROE for Barnes Group is:
4.6% = US$63m ÷ US$1.4b (Based on the trailing twelve months to June 2023).
The 'return' is the amount earned after tax over the last twelve months. One way to conceptualize this is that for each $1 of shareholders' capital it has, the company made $0.05 in profit.
Why Is ROE Important For Earnings Growth?
We have already established that ROE serves as an efficient profit-generating gauge for a company's future earnings. We now need to evaluate how much profit the company reinvests or "retains" for future growth which then gives us an idea about the growth potential of the company. Generally speaking, other things being equal, firms with a high return on equity and profit retention, have a higher growth rate than firms that don’t share these attributes.
Barnes Group's Earnings Growth And 4.6% ROE
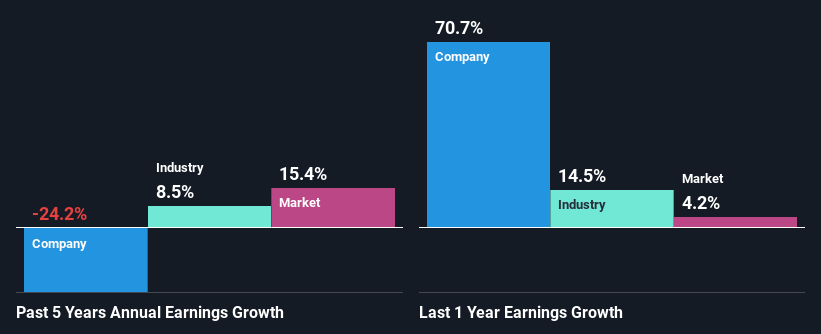
At first glance, Barnes Group's ROE doesn't look very promising. We then compared the company's ROE to the broader industry and were disappointed to see that the ROE is lower than the industry average of 14%. Therefore, it might not be wrong to say that the five year net income decline of 24% seen by Barnes Group was probably the result of it having a lower ROE. We reckon that there could also be other factors at play here. Such as - low earnings retention or poor allocation of capital.
That being said, we compared Barnes Group's performance with the industry and were concerned when we found that while the company has shrunk its earnings, the industry has grown its earnings at a rate of 8.5% in the same 5-year period.
The basis for attaching value to a company is, to a great extent, tied to its earnings growth. The investor should try to establish if the expected growth or decline in earnings, whichever the case may be, is priced in. Doing so will help them establish if the stock's future looks promising or ominous. What is B worth today? The intrinsic value infographic in our free research report helps visualize whether B is currently mispriced by the market.
Is Barnes Group Using Its Retained Earnings Effectively?
Barnes Group has a high three-year median payout ratio of 51% (that is, it is retaining 49% of its profits). This suggests that the company is paying most of its profits as dividends to its shareholders. This goes some way in explaining why its earnings have been shrinking. The business is only left with a small pool of capital to reinvest - A vicious cycle that doesn't benefit the company in the long-run.
In addition, Barnes Group has been paying dividends over a period of at least ten years suggesting that keeping up dividend payments is way more important to the management even if it comes at the cost of business growth.
Conclusion
On the whole, Barnes Group's performance is quite a big let-down. The company has seen a lack of earnings growth as a result of retaining very little profits and whatever little it does retain, is being reinvested at a very low rate of return. Having said that, looking at current analyst estimates, we found that the company's earnings growth rate is expected to see a huge improvement. To know more about the latest analysts predictions for the company, check out this visualization of analyst forecasts for the company.
Have feedback on this article? Concerned about the content? Get in touch with us directly. Alternatively, email editorial-team (at) simplywallst.com.
This article by Simply Wall St is general in nature. We provide commentary based on historical data and analyst forecasts only using an unbiased methodology and our articles are not intended to be financial advice. It does not constitute a recommendation to buy or sell any stock, and does not take account of your objectives, or your financial situation. We aim to bring you long-term focused analysis driven by fundamental data. Note that our analysis may not factor in the latest price-sensitive company announcements or qualitative material. Simply Wall St has no position in any stocks mentioned.
Join A Paid User Research Session
You’ll receive a US$30 Amazon Gift card for 1 hour of your time while helping us build better investing tools for the individual investors like yourself. Sign up here
