Is Weakness In American Financial Group, Inc. (NYSE:AFG) Stock A Sign That The Market Could be Wrong Given Its Strong Financial Prospects?
It is hard to get excited after looking at American Financial Group's (NYSE:AFG) recent performance, when its stock has declined 15% over the past three months. However, a closer look at its sound financials might cause you to think again. Given that fundamentals usually drive long-term market outcomes, the company is worth looking at. In this article, we decided to focus on American Financial Group's ROE.
Return on equity or ROE is an important factor to be considered by a shareholder because it tells them how effectively their capital is being reinvested. Put another way, it reveals the company's success at turning shareholder investments into profits.
View our latest analysis for American Financial Group
How Is ROE Calculated?
ROE can be calculated by using the formula:
Return on Equity = Net Profit (from continuing operations) ÷ Shareholders' Equity
So, based on the above formula, the ROE for American Financial Group is:
21% = US$820m ÷ US$3.9b (Based on the trailing twelve months to March 2023).
The 'return' is the income the business earned over the last year. One way to conceptualize this is that for each $1 of shareholders' capital it has, the company made $0.21 in profit.
Why Is ROE Important For Earnings Growth?
Thus far, we have learned that ROE measures how efficiently a company is generating its profits. We now need to evaluate how much profit the company reinvests or "retains" for future growth which then gives us an idea about the growth potential of the company. Assuming all else is equal, companies that have both a higher return on equity and higher profit retention are usually the ones that have a higher growth rate when compared to companies that don't have the same features.
A Side By Side comparison of American Financial Group's Earnings Growth And 21% ROE
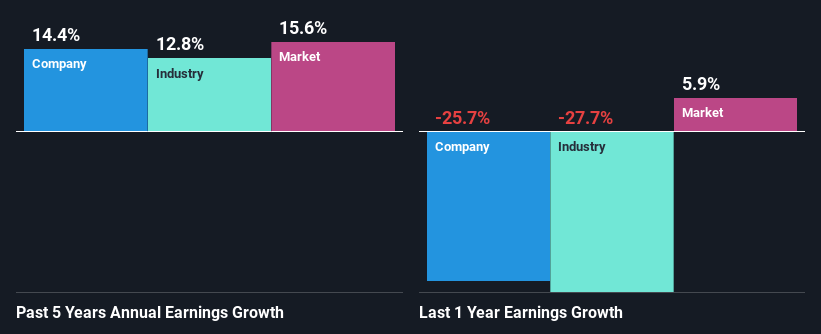
To start with, American Financial Group's ROE looks acceptable. Further, the company's ROE compares quite favorably to the industry average of 9.8%. This certainly adds some context to American Financial Group's decent 14% net income growth seen over the past five years.
As a next step, we compared American Financial Group's net income growth with the industry and found that the company has a similar growth figure when compared with the industry average growth rate of 13% in the same period.
The basis for attaching value to a company is, to a great extent, tied to its earnings growth. It’s important for an investor to know whether the market has priced in the company's expected earnings growth (or decline). Doing so will help them establish if the stock's future looks promising or ominous. Is AFG fairly valued? This infographic on the company's intrinsic value has everything you need to know.
Is American Financial Group Making Efficient Use Of Its Profits?
American Financial Group's three-year median payout ratio to shareholders is 23% (implying that it retains 77% of its income), which is on the lower side, so it seems like the management is reinvesting profits heavily to grow its business.
Additionally, American Financial Group has paid dividends over a period of at least ten years which means that the company is pretty serious about sharing its profits with shareholders.
Summary
On the whole, we feel that American Financial Group's performance has been quite good. Particularly, we like that the company is reinvesting heavily into its business, and at a high rate of return. Unsurprisingly, this has led to an impressive earnings growth. On studying current analyst estimates, we found that analysts expect the company to continue its recent growth streak. To know more about the latest analysts predictions for the company, check out this visualization of analyst forecasts for the company.
Have feedback on this article? Concerned about the content? Get in touch with us directly. Alternatively, email editorial-team (at) simplywallst.com.
This article by Simply Wall St is general in nature. We provide commentary based on historical data and analyst forecasts only using an unbiased methodology and our articles are not intended to be financial advice. It does not constitute a recommendation to buy or sell any stock, and does not take account of your objectives, or your financial situation. We aim to bring you long-term focused analysis driven by fundamental data. Note that our analysis may not factor in the latest price-sensitive company announcements or qualitative material. Simply Wall St has no position in any stocks mentioned.
Join A Paid User Research Session
You’ll receive a US$30 Amazon Gift card for 1 hour of your time while helping us build better investing tools for the individual investors like yourself. Sign up here
