Will Weakness in B2Gold Corp.'s (TSE:BTO) Stock Prove Temporary Given Strong Fundamentals?
It is hard to get excited after looking at B2Gold's (TSE:BTO) recent performance, when its stock has declined 14% over the past three months. However, a closer look at its sound financials might cause you to think again. Given that fundamentals usually drive long-term market outcomes, the company is worth looking at. Particularly, we will be paying attention to B2Gold's ROE today.
Return on Equity or ROE is a test of how effectively a company is growing its value and managing investors’ money. Put another way, it reveals the company's success at turning shareholder investments into profits.
Check out our latest analysis for B2Gold
How To Calculate Return On Equity?
Return on equity can be calculated by using the formula:
Return on Equity = Net Profit (from continuing operations) ÷ Shareholders' Equity
So, based on the above formula, the ROE for B2Gold is:
17% = US$482m ÷ US$2.8b (Based on the trailing twelve months to September 2021).
The 'return' is the income the business earned over the last year. That means that for every CA$1 worth of shareholders' equity, the company generated CA$0.17 in profit.
What Has ROE Got To Do With Earnings Growth?
We have already established that ROE serves as an efficient profit-generating gauge for a company's future earnings. We now need to evaluate how much profit the company reinvests or "retains" for future growth which then gives us an idea about the growth potential of the company. Assuming everything else remains unchanged, the higher the ROE and profit retention, the higher the growth rate of a company compared to companies that don't necessarily bear these characteristics.
A Side By Side comparison of B2Gold's Earnings Growth And 17% ROE
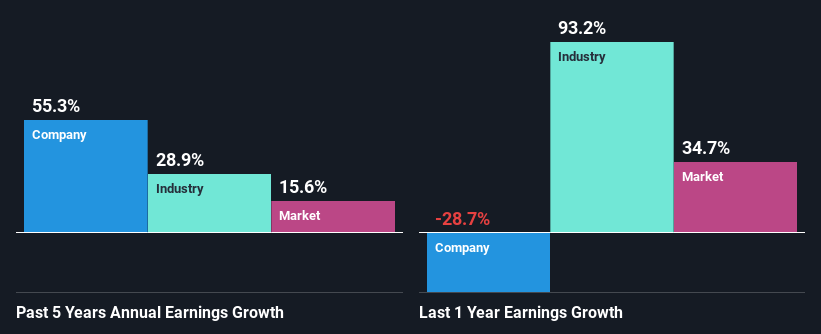
To start with, B2Gold's ROE looks acceptable. Further, the company's ROE is similar to the industry average of 15%. This probably goes some way in explaining B2Gold's significant 55% net income growth over the past five years amongst other factors. We reckon that there could also be other factors at play here. For instance, the company has a low payout ratio or is being managed efficiently.
As a next step, we compared B2Gold's net income growth with the industry, and pleasingly, we found that the growth seen by the company is higher than the average industry growth of 29%.
Earnings growth is an important metric to consider when valuing a stock. The investor should try to establish if the expected growth or decline in earnings, whichever the case may be, is priced in. By doing so, they will have an idea if the stock is headed into clear blue waters or if swampy waters await. Has the market priced in the future outlook for BTO? You can find out in our latest intrinsic value infographic research report.
Is B2Gold Making Efficient Use Of Its Profits?
B2Gold's three-year median payout ratio to shareholders is 16%, which is quite low. This implies that the company is retaining 84% of its profits. So it looks like B2Gold is reinvesting profits heavily to grow its business, which shows in its earnings growth.
While B2Gold has seen growth in its earnings, it only recently started to pay a dividend. It is most likely that the company decided to impress new and existing shareholders with a dividend. Upon studying the latest analysts' consensus data, we found that the company's future payout ratio is expected to rise to 41% over the next three years. Despite the higher expected payout ratio, the company's ROE is not expected to change by much.
Summary
Overall, we are quite pleased with B2Gold's performance. In particular, it's great to see that the company is investing heavily into its business and along with a high rate of return, that has resulted in a sizeable growth in its earnings. With that said, on studying the latest analyst forecasts, we found that while the company has seen growth in its past earnings, analysts expect its future earnings to shrink. Are these analysts expectations based on the broad expectations for the industry, or on the company's fundamentals? Click here to be taken to our analyst's forecasts page for the company.
Have feedback on this article? Concerned about the content? Get in touch with us directly. Alternatively, email editorial-team (at) simplywallst.com.
This article by Simply Wall St is general in nature. We provide commentary based on historical data and analyst forecasts only using an unbiased methodology and our articles are not intended to be financial advice. It does not constitute a recommendation to buy or sell any stock, and does not take account of your objectives, or your financial situation. We aim to bring you long-term focused analysis driven by fundamental data. Note that our analysis may not factor in the latest price-sensitive company announcements or qualitative material. Simply Wall St has no position in any stocks mentioned.
