Will Weakness in EMIS Group plc's (LON:EMIS) Stock Prove Temporary Given Strong Fundamentals?
With its stock down 5.6% over the past month, it is easy to disregard EMIS Group (LON:EMIS). However, stock prices are usually driven by a company’s financial performance over the long term, which in this case looks quite promising. Particularly, we will be paying attention to EMIS Group's ROE today.
ROE or return on equity is a useful tool to assess how effectively a company can generate returns on the investment it received from its shareholders. In other words, it is a profitability ratio which measures the rate of return on the capital provided by the company's shareholders.
View our latest analysis for EMIS Group
How To Calculate Return On Equity?
ROE can be calculated by using the formula:
Return on Equity = Net Profit (from continuing operations) ÷ Shareholders' Equity
So, based on the above formula, the ROE for EMIS Group is:
23% = UK£29m ÷ UK£128m (Based on the trailing twelve months to December 2021).
The 'return' refers to a company's earnings over the last year. So, this means that for every £1 of its shareholder's investments, the company generates a profit of £0.23.
What Has ROE Got To Do With Earnings Growth?
We have already established that ROE serves as an efficient profit-generating gauge for a company's future earnings. Based on how much of its profits the company chooses to reinvest or "retain", we are then able to evaluate a company's future ability to generate profits. Assuming all else is equal, companies that have both a higher return on equity and higher profit retention are usually the ones that have a higher growth rate when compared to companies that don't have the same features.
EMIS Group's Earnings Growth And 23% ROE
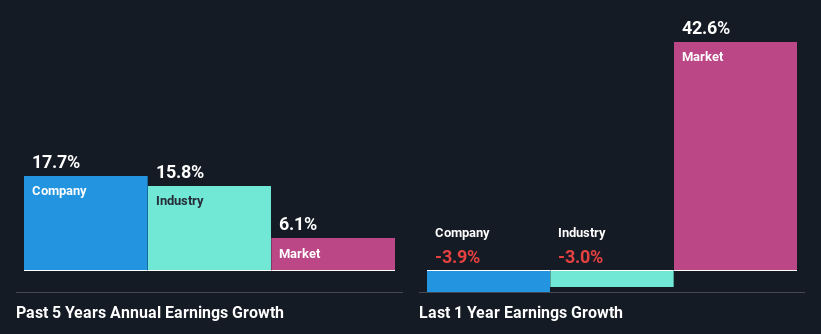
To begin with, EMIS Group has a pretty high ROE which is interesting. Second, a comparison with the average ROE reported by the industry of 12% also doesn't go unnoticed by us. This likely paved the way for the modest 18% net income growth seen by EMIS Group over the past five years. growth
Next, on comparing with the industry net income growth, we found that EMIS Group's growth is quite high when compared to the industry average growth of 7.2% in the same period, which is great to see.
Earnings growth is an important metric to consider when valuing a stock. What investors need to determine next is if the expected earnings growth, or the lack of it, is already built into the share price. This then helps them determine if the stock is placed for a bright or bleak future. What is EMIS worth today? The intrinsic value infographic in our free research report helps visualize whether EMIS is currently mispriced by the market.
Is EMIS Group Making Efficient Use Of Its Profits?
EMIS Group has a significant three-year median payout ratio of 76%, meaning that it is left with only 24% to reinvest into its business. This implies that the company has been able to achieve decent earnings growth despite returning most of its profits to shareholders.
Besides, EMIS Group has been paying dividends for at least ten years or more. This shows that the company is committed to sharing profits with its shareholders. Based on the latest analysts' estimates, we found that the company's future payout ratio over the next three years is expected to hold steady at 62%.
Summary
Overall, we are quite pleased with EMIS Group's performance. We are particularly impressed by the considerable earnings growth posted by the company, which was likely backed by its high ROE. While the company is paying out most of its earnings as dividends, it has been able to grow its earnings in spite of it, so that's probably a good sign. Having said that, the company's earnings growth is expected to slow down, as forecasted in the current analyst estimates. Are these analysts expectations based on the broad expectations for the industry, or on the company's fundamentals? Click here to be taken to our analyst's forecasts page for the company.
Have feedback on this article? Concerned about the content? Get in touch with us directly. Alternatively, email editorial-team (at) simplywallst.com.
This article by Simply Wall St is general in nature. We provide commentary based on historical data and analyst forecasts only using an unbiased methodology and our articles are not intended to be financial advice. It does not constitute a recommendation to buy or sell any stock, and does not take account of your objectives, or your financial situation. We aim to bring you long-term focused analysis driven by fundamental data. Note that our analysis may not factor in the latest price-sensitive company announcements or qualitative material. Simply Wall St has no position in any stocks mentioned.
