Should Weakness in Enerpac Tool Group Corp.'s (NYSE:EPAC) Stock Be Seen As A Sign That Market Will Correct The Share Price Given Decent Financials?
With its stock down 10% over the past three months, it is easy to disregard Enerpac Tool Group (NYSE:EPAC). But if you pay close attention, you might find that its key financial indicators look quite decent, which could mean that the stock could potentially rise in the long-term given how markets usually reward more resilient long-term fundamentals. Particularly, we will be paying attention to Enerpac Tool Group's ROE today.
Return on equity or ROE is an important factor to be considered by a shareholder because it tells them how effectively their capital is being reinvested. In short, ROE shows the profit each dollar generates with respect to its shareholder investments.
See our latest analysis for Enerpac Tool Group
How Do You Calculate Return On Equity?
The formula for ROE is:
Return on Equity = Net Profit (from continuing operations) ÷ Shareholders' Equity
So, based on the above formula, the ROE for Enerpac Tool Group is:
4.3% = US$16m ÷ US$366m (Based on the trailing twelve months to May 2022).
The 'return' is the income the business earned over the last year. Another way to think of that is that for every $1 worth of equity, the company was able to earn $0.04 in profit.
Why Is ROE Important For Earnings Growth?
We have already established that ROE serves as an efficient profit-generating gauge for a company's future earnings. Depending on how much of these profits the company reinvests or "retains", and how effectively it does so, we are then able to assess a company’s earnings growth potential. Assuming everything else remains unchanged, the higher the ROE and profit retention, the higher the growth rate of a company compared to companies that don't necessarily bear these characteristics.
Enerpac Tool Group's Earnings Growth And 4.3% ROE
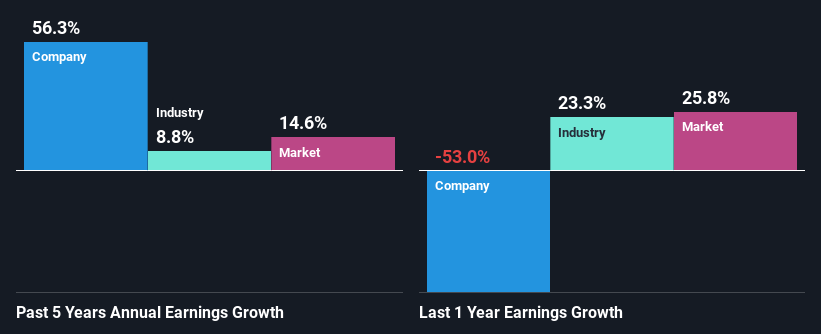
When you first look at it, Enerpac Tool Group's ROE doesn't look that attractive. A quick further study shows that the company's ROE doesn't compare favorably to the industry average of 12% either. Despite this, surprisingly, Enerpac Tool Group saw an exceptional 56% net income growth over the past five years. We reckon that there could be other factors at play here. Such as - high earnings retention or an efficient management in place.
We then compared Enerpac Tool Group's net income growth with the industry and we're pleased to see that the company's growth figure is higher when compared with the industry which has a growth rate of 8.8% in the same period.
Earnings growth is an important metric to consider when valuing a stock. The investor should try to establish if the expected growth or decline in earnings, whichever the case may be, is priced in. This then helps them determine if the stock is placed for a bright or bleak future. If you're wondering about Enerpac Tool Group's's valuation, check out this gauge of its price-to-earnings ratio, as compared to its industry.
Is Enerpac Tool Group Making Efficient Use Of Its Profits?
Enerpac Tool Group's three-year median payout ratio to shareholders is 7.9%, which is quite low. This implies that the company is retaining 92% of its profits. This suggests that the management is reinvesting most of the profits to grow the business as evidenced by the growth seen by the company.
Additionally, Enerpac Tool Group has paid dividends over a period of at least ten years which means that the company is pretty serious about sharing its profits with shareholders.
Summary
In total, it does look like Enerpac Tool Group has some positive aspects to its business. Even in spite of the low rate of return, the company has posted impressive earnings growth as a result of reinvesting heavily into its business. We also studied the latest analyst forecasts and found that the company's earnings growth is expected be similar to its current growth rate. To know more about the latest analysts predictions for the company, check out this visualization of analyst forecasts for the company.
Have feedback on this article? Concerned about the content? Get in touch with us directly. Alternatively, email editorial-team (at) simplywallst.com.
This article by Simply Wall St is general in nature. We provide commentary based on historical data and analyst forecasts only using an unbiased methodology and our articles are not intended to be financial advice. It does not constitute a recommendation to buy or sell any stock, and does not take account of your objectives, or your financial situation. We aim to bring you long-term focused analysis driven by fundamental data. Note that our analysis may not factor in the latest price-sensitive company announcements or qualitative material. Simply Wall St has no position in any stocks mentioned.
Join A Paid User Research Session
You’ll receive a US$30 Amazon Gift card for 1 hour of your time while helping us build better investing tools for the individual investors like yourself. Sign up here
