Will Weakness in Kadant Inc.'s (NYSE:KAI) Stock Prove Temporary Given Strong Fundamentals?
Kadant (NYSE:KAI) has had a rough three months with its share price down 13%. But if you pay close attention, you might gather that its strong financials could mean that the stock could potentially see an increase in value in the long-term, given how markets usually reward companies with good financial health. In this article, we decided to focus on Kadant's ROE.
Return on equity or ROE is a key measure used to assess how efficiently a company's management is utilizing the company's capital. In other words, it is a profitability ratio which measures the rate of return on the capital provided by the company's shareholders.
Check out our latest analysis for Kadant
How Is ROE Calculated?
ROE can be calculated by using the formula:
Return on Equity = Net Profit (from continuing operations) ÷ Shareholders' Equity
So, based on the above formula, the ROE for Kadant is:
19% = US$113m ÷ US$606m (Based on the trailing twelve months to July 2022).
The 'return' is the income the business earned over the last year. That means that for every $1 worth of shareholders' equity, the company generated $0.19 in profit.
Why Is ROE Important For Earnings Growth?
So far, we've learned that ROE is a measure of a company's profitability. Based on how much of its profits the company chooses to reinvest or "retain", we are then able to evaluate a company's future ability to generate profits. Generally speaking, other things being equal, firms with a high return on equity and profit retention, have a higher growth rate than firms that don’t share these attributes.
A Side By Side comparison of Kadant's Earnings Growth And 19% ROE
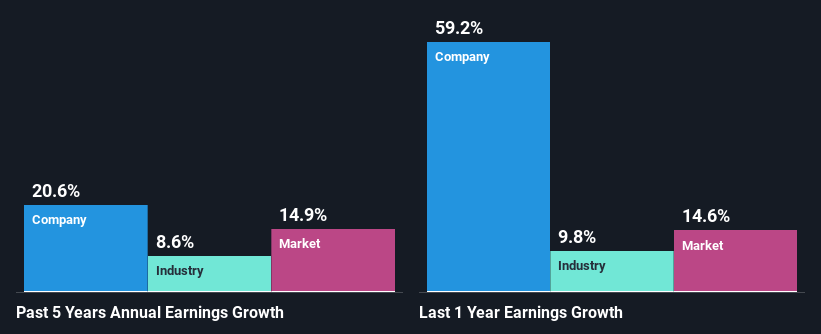
To start with, Kadant's ROE looks acceptable. On comparing with the average industry ROE of 13% the company's ROE looks pretty remarkable. Probably as a result of this, Kadant was able to see an impressive net income growth of 21% over the last five years. We believe that there might also be other aspects that are positively influencing the company's earnings growth. For example, it is possible that the company's management has made some good strategic decisions, or that the company has a low payout ratio.
Next, on comparing with the industry net income growth, we found that Kadant's growth is quite high when compared to the industry average growth of 8.6% in the same period, which is great to see.
Earnings growth is an important metric to consider when valuing a stock. It’s important for an investor to know whether the market has priced in the company's expected earnings growth (or decline). Doing so will help them establish if the stock's future looks promising or ominous. Is KAI fairly valued? This infographic on the company's intrinsic value has everything you need to know.
Is Kadant Making Efficient Use Of Its Profits?
Kadant's three-year median payout ratio to shareholders is 18%, which is quite low. This implies that the company is retaining 82% of its profits. So it seems like the management is reinvesting profits heavily to grow its business and this reflects in its earnings growth number.
Moreover, Kadant is determined to keep sharing its profits with shareholders which we infer from its long history of paying a dividend for at least ten years.
Summary
In total, we are pretty happy with Kadant's performance. Particularly, we like that the company is reinvesting heavily into its business, and at a high rate of return. Unsurprisingly, this has led to an impressive earnings growth. With that said, on studying the latest analyst forecasts, we found that while the company has seen growth in its past earnings, analysts expect its future earnings to shrink. To know more about the latest analysts predictions for the company, check out this visualization of analyst forecasts for the company.
Have feedback on this article? Concerned about the content? Get in touch with us directly. Alternatively, email editorial-team (at) simplywallst.com.
This article by Simply Wall St is general in nature. We provide commentary based on historical data and analyst forecasts only using an unbiased methodology and our articles are not intended to be financial advice. It does not constitute a recommendation to buy or sell any stock, and does not take account of your objectives, or your financial situation. We aim to bring you long-term focused analysis driven by fundamental data. Note that our analysis may not factor in the latest price-sensitive company announcements or qualitative material. Simply Wall St has no position in any stocks mentioned.
Join A Paid User Research Session
You’ll receive a US$30 Amazon Gift card for 1 hour of your time while helping us build better investing tools for the individual investors like yourself. Sign up here
