Should Weakness in National Research Corporation's (NASDAQ:NRC) Stock Be Seen As A Sign That Market Will Correct The Share Price Given Decent Financials?
National Research (NASDAQ:NRC) has had a rough month with its share price down 8.8%. However, the company's fundamentals look pretty decent, and long-term financials are usually aligned with future market price movements. In this article, we decided to focus on National Research's ROE.
Return on Equity or ROE is a test of how effectively a company is growing its value and managing investors’ money. In short, ROE shows the profit each dollar generates with respect to its shareholder investments.
Check out our latest analysis for National Research
How Is ROE Calculated?
The formula for return on equity is:
Return on Equity = Net Profit (from continuing operations) ÷ Shareholders' Equity
So, based on the above formula, the ROE for National Research is:
38% = US$29m ÷ US$78m (Based on the trailing twelve months to June 2023).
The 'return' is the yearly profit. So, this means that for every $1 of its shareholder's investments, the company generates a profit of $0.38.
Why Is ROE Important For Earnings Growth?
So far, we've learned that ROE is a measure of a company's profitability. Based on how much of its profits the company chooses to reinvest or "retain", we are then able to evaluate a company's future ability to generate profits. Assuming everything else remains unchanged, the higher the ROE and profit retention, the higher the growth rate of a company compared to companies that don't necessarily bear these characteristics.
National Research's Earnings Growth And 38% ROE
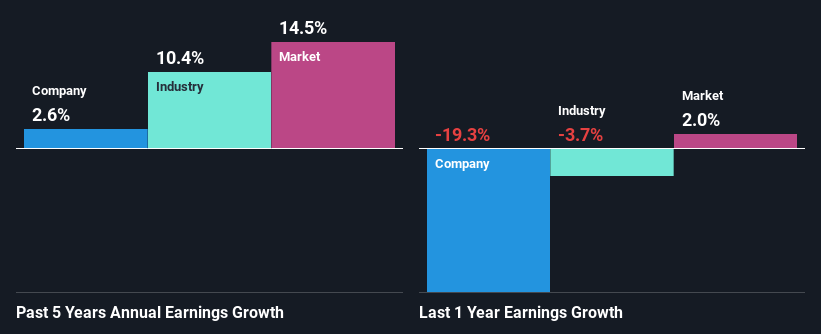
To begin with, National Research has a pretty high ROE which is interesting. Second, a comparison with the average ROE reported by the industry of 11% also doesn't go unnoticed by us. Despite this, National Research's five year net income growth was quite low averaging at only 2.6%. That's a bit unexpected from a company which has such a high rate of return. Such a scenario is likely to take place when a company pays out a huge portion of its earnings as dividends, or is faced with competitive pressures.
We then compared National Research's net income growth with the industry and found that the company's growth figure is lower than the average industry growth rate of 10% in the same 5-year period, which is a bit concerning.
Earnings growth is an important metric to consider when valuing a stock. It’s important for an investor to know whether the market has priced in the company's expected earnings growth (or decline). This then helps them determine if the stock is placed for a bright or bleak future. One good indicator of expected earnings growth is the P/E ratio which determines the price the market is willing to pay for a stock based on its earnings prospects. So, you may want to check if National Research is trading on a high P/E or a low P/E, relative to its industry.
Is National Research Efficiently Re-investing Its Profits?
Despite having a normal three-year median payout ratio of 41% (or a retention ratio of 59% over the past three years, National Research has seen very little growth in earnings as we saw above. So there could be some other explanation in that regard. For instance, the company's business may be deteriorating.
In addition, National Research has been paying dividends over a period of nine years suggesting that keeping up dividend payments is way more important to the management even if it comes at the cost of business growth.
Conclusion
On the whole, we do feel that National Research has some positive attributes. Yet, the low earnings growth is a bit concerning, especially given that the company has a high rate of return and is reinvesting ma huge portion of its profits. By the looks of it, there could be some other factors, not necessarily in control of the business, that's preventing growth.
Have feedback on this article? Concerned about the content? Get in touch with us directly. Alternatively, email editorial-team (at) simplywallst.com.
This article by Simply Wall St is general in nature. We provide commentary based on historical data and analyst forecasts only using an unbiased methodology and our articles are not intended to be financial advice. It does not constitute a recommendation to buy or sell any stock, and does not take account of your objectives, or your financial situation. We aim to bring you long-term focused analysis driven by fundamental data. Note that our analysis may not factor in the latest price-sensitive company announcements or qualitative material. Simply Wall St has no position in any stocks mentioned.
