Is Weakness In QES Group Berhad (KLSE:QES) Stock A Sign That The Market Could be Wrong Given Its Strong Financial Prospects?
It is hard to get excited after looking at QES Group Berhad's (KLSE:QES) recent performance, when its stock has declined 16% over the past three months. However, stock prices are usually driven by a company’s financial performance over the long term, which in this case looks quite promising. Particularly, we will be paying attention to QES Group Berhad's ROE today.
Return on Equity or ROE is a test of how effectively a company is growing its value and managing investors’ money. In other words, it is a profitability ratio which measures the rate of return on the capital provided by the company's shareholders.
Check out our latest analysis for QES Group Berhad
How Do You Calculate Return On Equity?
The formula for ROE is:
Return on Equity = Net Profit (from continuing operations) ÷ Shareholders' Equity
So, based on the above formula, the ROE for QES Group Berhad is:
16% = RM26m ÷ RM164m (Based on the trailing twelve months to March 2023).
The 'return' refers to a company's earnings over the last year. Another way to think of that is that for every MYR1 worth of equity, the company was able to earn MYR0.16 in profit.
Why Is ROE Important For Earnings Growth?
Thus far, we have learned that ROE measures how efficiently a company is generating its profits. Depending on how much of these profits the company reinvests or "retains", and how effectively it does so, we are then able to assess a company’s earnings growth potential. Generally speaking, other things being equal, firms with a high return on equity and profit retention, have a higher growth rate than firms that don’t share these attributes.
QES Group Berhad's Earnings Growth And 16% ROE
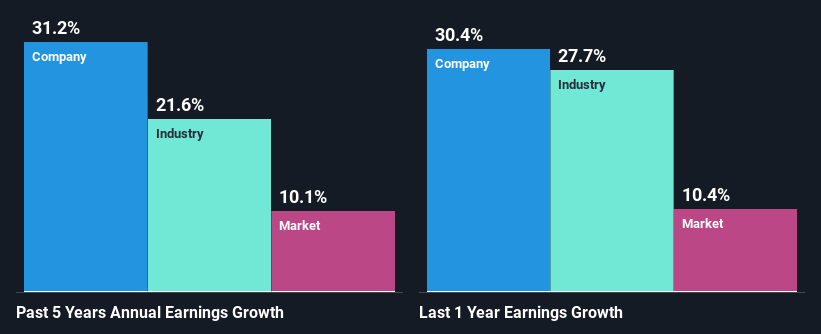
At first glance, QES Group Berhad seems to have a decent ROE. Even when compared to the industry average of 16% the company's ROE looks quite decent. This certainly adds some context to QES Group Berhad's exceptional 31% net income growth seen over the past five years. However, there could also be other drivers behind this growth. Such as - high earnings retention or an efficient management in place.
We then compared QES Group Berhad's net income growth with the industry and we're pleased to see that the company's growth figure is higher when compared with the industry which has a growth rate of 22% in the same period.
The basis for attaching value to a company is, to a great extent, tied to its earnings growth. It’s important for an investor to know whether the market has priced in the company's expected earnings growth (or decline). Doing so will help them establish if the stock's future looks promising or ominous. If you're wondering about QES Group Berhad's's valuation, check out this gauge of its price-to-earnings ratio, as compared to its industry.
Is QES Group Berhad Efficiently Re-investing Its Profits?
QES Group Berhad has a really low three-year median payout ratio of 17%, meaning that it has the remaining 83% left over to reinvest into its business. This suggests that the management is reinvesting most of the profits to grow the business as evidenced by the growth seen by the company.
Besides, QES Group Berhad has been paying dividends over a period of four years. This shows that the company is committed to sharing profits with its shareholders.
Conclusion
In total, we are pretty happy with QES Group Berhad's performance. Specifically, we like that the company is reinvesting a huge chunk of its profits at a high rate of return. This of course has caused the company to see substantial growth in its earnings. That being so, a study of the latest analyst forecasts show that the company is expected to see a slowdown in its future earnings growth. To know more about the latest analysts predictions for the company, check out this visualization of analyst forecasts for the company.
Have feedback on this article? Concerned about the content? Get in touch with us directly. Alternatively, email editorial-team (at) simplywallst.com.
This article by Simply Wall St is general in nature. We provide commentary based on historical data and analyst forecasts only using an unbiased methodology and our articles are not intended to be financial advice. It does not constitute a recommendation to buy or sell any stock, and does not take account of your objectives, or your financial situation. We aim to bring you long-term focused analysis driven by fundamental data. Note that our analysis may not factor in the latest price-sensitive company announcements or qualitative material. Simply Wall St has no position in any stocks mentioned.
Join A Paid User Research Session
You’ll receive a US$30 Amazon Gift card for 1 hour of your time while helping us build better investing tools for the individual investors like yourself. Sign up here
