Is Weakness In Rush Enterprises, Inc. (NASDAQ:RUSH.B) Stock A Sign That The Market Could be Wrong Given Its Strong Financial Prospects?
It is hard to get excited after looking at Rush Enterprises' (NASDAQ:RUSH.B) recent performance, when its stock has declined 5.0% over the past three months. But if you pay close attention, you might gather that its strong financials could mean that the stock could potentially see an increase in value in the long-term, given how markets usually reward companies with good financial health. In this article, we decided to focus on Rush Enterprises' ROE.
Return on equity or ROE is a key measure used to assess how efficiently a company's management is utilizing the company's capital. In simpler terms, it measures the profitability of a company in relation to shareholder's equity.
View our latest analysis for Rush Enterprises
How Is ROE Calculated?
Return on equity can be calculated by using the formula:
Return on Equity = Net Profit (from continuing operations) ÷ Shareholders' Equity
So, based on the above formula, the ROE for Rush Enterprises is:
21% = US$341m ÷ US$1.6b (Based on the trailing twelve months to June 2022).
The 'return' is the amount earned after tax over the last twelve months. So, this means that for every $1 of its shareholder's investments, the company generates a profit of $0.21.
What Is The Relationship Between ROE And Earnings Growth?
Thus far, we have learned that ROE measures how efficiently a company is generating its profits. Based on how much of its profits the company chooses to reinvest or "retain", we are then able to evaluate a company's future ability to generate profits. Generally speaking, other things being equal, firms with a high return on equity and profit retention, have a higher growth rate than firms that don’t share these attributes.
Rush Enterprises' Earnings Growth And 21% ROE
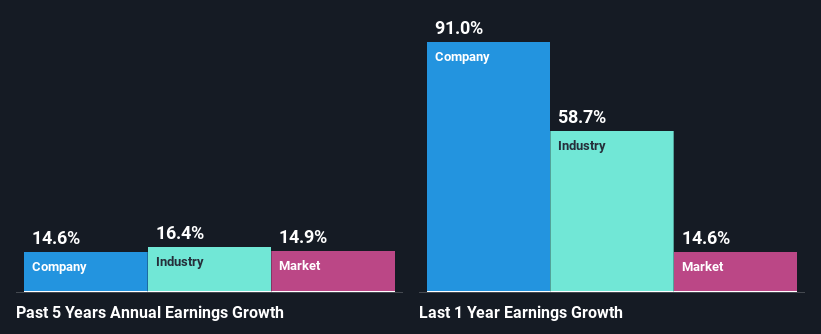
At first glance, Rush Enterprises seems to have a decent ROE. Even when compared to the industry average of 22% the company's ROE looks quite decent. This certainly adds some context to Rush Enterprises' moderate 15% net income growth seen over the past five years.
Next, on comparing Rush Enterprises' net income growth with the industry, we found that the company's reported growth is similar to the industry average growth rate of 16% in the same period.
Earnings growth is an important metric to consider when valuing a stock. What investors need to determine next is if the expected earnings growth, or the lack of it, is already built into the share price. This then helps them determine if the stock is placed for a bright or bleak future. One good indicator of expected earnings growth is the P/E ratio which determines the price the market is willing to pay for a stock based on its earnings prospects. So, you may want to check if Rush Enterprises is trading on a high P/E or a low P/E, relative to its industry.
Is Rush Enterprises Using Its Retained Earnings Effectively?
Rush Enterprises' three-year median payout ratio to shareholders is 17% (implying that it retains 83% of its income), which is on the lower side, so it seems like the management is reinvesting profits heavily to grow its business.
Moreover, Rush Enterprises is determined to keep sharing its profits with shareholders which we infer from its long history of four years of paying a dividend.
Conclusion
Overall, we are quite pleased with Rush Enterprises' performance. In particular, it's great to see that the company is investing heavily into its business and along with a high rate of return, that has resulted in a sizeable growth in its earnings. With that said, on studying the latest analyst forecasts, we found that while the company has seen growth in its past earnings, analysts expect its future earnings to shrink. To know more about the company's future earnings growth forecasts take a look at this free report on analyst forecasts for the company to find out more.
Have feedback on this article? Concerned about the content? Get in touch with us directly. Alternatively, email editorial-team (at) simplywallst.com.
This article by Simply Wall St is general in nature. We provide commentary based on historical data and analyst forecasts only using an unbiased methodology and our articles are not intended to be financial advice. It does not constitute a recommendation to buy or sell any stock, and does not take account of your objectives, or your financial situation. We aim to bring you long-term focused analysis driven by fundamental data. Note that our analysis may not factor in the latest price-sensitive company announcements or qualitative material. Simply Wall St has no position in any stocks mentioned.
Join A Paid User Research Session
You’ll receive a US$30 Amazon Gift card for 1 hour of your time while helping us build better investing tools for the individual investors like yourself. Sign up here
