We're Keeping An Eye On 17 Education & Technology Group's (NASDAQ:YQ) Cash Burn Rate
Just because a business does not make any money, does not mean that the stock will go down. For example, although software-as-a-service business Salesforce.com lost money for years while it grew recurring revenue, if you held shares since 2005, you'd have done very well indeed. But while the successes are well known, investors should not ignore the very many unprofitable companies that simply burn through all their cash and collapse.
Given this risk, we thought we'd take a look at whether 17 Education & Technology Group (NASDAQ:YQ) shareholders should be worried about its cash burn. In this article, we define cash burn as its annual (negative) free cash flow, which is the amount of money a company spends each year to fund its growth. The first step is to compare its cash burn with its cash reserves, to give us its 'cash runway'.
Check out our latest analysis for 17 Education & Technology Group
Does 17 Education & Technology Group Have A Long Cash Runway?
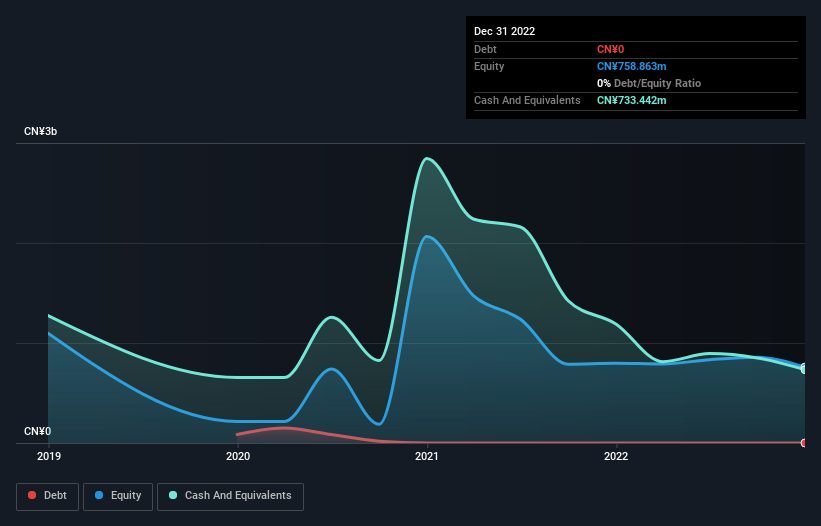
A company's cash runway is the amount of time it would take to burn through its cash reserves at its current cash burn rate. When 17 Education & Technology Group last reported its balance sheet in December 2022, it had zero debt and cash worth CN¥733m. Importantly, its cash burn was CN¥467m over the trailing twelve months. Therefore, from December 2022 it had roughly 19 months of cash runway. That's not too bad, but it's fair to say the end of the cash runway is in sight, unless cash burn reduces drastically. The image below shows how its cash balance has been changing over the last few years.
How Well Is 17 Education & Technology Group Growing?
Happily, 17 Education & Technology Group is travelling in the right direction when it comes to its cash burn, which is down 71% over the last year. But the top line growth tells a different story, with operating revenue falling 76% in that time. In light of the data above, we're fairly sanguine about the business growth trajectory. Of course, we've only taken a quick look at the stock's growth metrics, here. This graph of historic earnings and revenue shows how 17 Education & Technology Group is building its business over time.
How Hard Would It Be For 17 Education & Technology Group To Raise More Cash For Growth?
While 17 Education & Technology Group seems to be in a fairly good position, it's still worth considering how easily it could raise more cash, even just to fuel faster growth. Issuing new shares, or taking on debt, are the most common ways for a listed company to raise more money for its business. Commonly, a business will sell new shares in itself to raise cash and drive growth. By looking at a company's cash burn relative to its market capitalisation, we gain insight on how much shareholders would be diluted if the company needed to raise enough cash to cover another year's cash burn.
17 Education & Technology Group has a market capitalisation of CN¥341m and burnt through CN¥467m last year, which is 137% of the company's market value. Given just how high that expenditure is, relative to the company's market value, we think there's an elevated risk of funding distress, and we would be very nervous about holding the stock.
Is 17 Education & Technology Group's Cash Burn A Worry?
On this analysis of 17 Education & Technology Group's cash burn, we think its cash burn reduction was reassuring, while its cash burn relative to its market cap has us a bit worried. Considering all the measures mentioned in this report, we reckon that its cash burn is fairly risky, and if we held shares we'd be watching like a hawk for any deterioration. Its important for readers to be cognizant of the risks that can affect the company's operations, and we've picked out 2 warning signs for 17 Education & Technology Group that investors should know when investing in the stock.
Of course, you might find a fantastic investment by looking elsewhere. So take a peek at this free list of interesting companies, and this list of stocks growth stocks (according to analyst forecasts)
Have feedback on this article? Concerned about the content? Get in touch with us directly. Alternatively, email editorial-team (at) simplywallst.com.
This article by Simply Wall St is general in nature. We provide commentary based on historical data and analyst forecasts only using an unbiased methodology and our articles are not intended to be financial advice. It does not constitute a recommendation to buy or sell any stock, and does not take account of your objectives, or your financial situation. We aim to bring you long-term focused analysis driven by fundamental data. Note that our analysis may not factor in the latest price-sensitive company announcements or qualitative material. Simply Wall St has no position in any stocks mentioned.
Join A Paid User Research Session
You’ll receive a US$30 Amazon Gift card for 1 hour of your time while helping us build better investing tools for the individual investors like yourself. Sign up here
