We're Keeping An Eye On Hyliion Holdings' (NYSE:HYLN) Cash Burn Rate
There's no doubt that money can be made by owning shares of unprofitable businesses. For example, although software-as-a-service business Salesforce.com lost money for years while it grew recurring revenue, if you held shares since 2005, you'd have done very well indeed. But while history lauds those rare successes, those that fail are often forgotten; who remembers Pets.com?
Given this risk, we thought we'd take a look at whether Hyliion Holdings (NYSE:HYLN) shareholders should be worried about its cash burn. For the purpose of this article, we'll define cash burn as the amount of cash the company is spending each year to fund its growth (also called its negative free cash flow). First, we'll determine its cash runway by comparing its cash burn with its cash reserves.
View our latest analysis for Hyliion Holdings
When Might Hyliion Holdings Run Out Of Money?
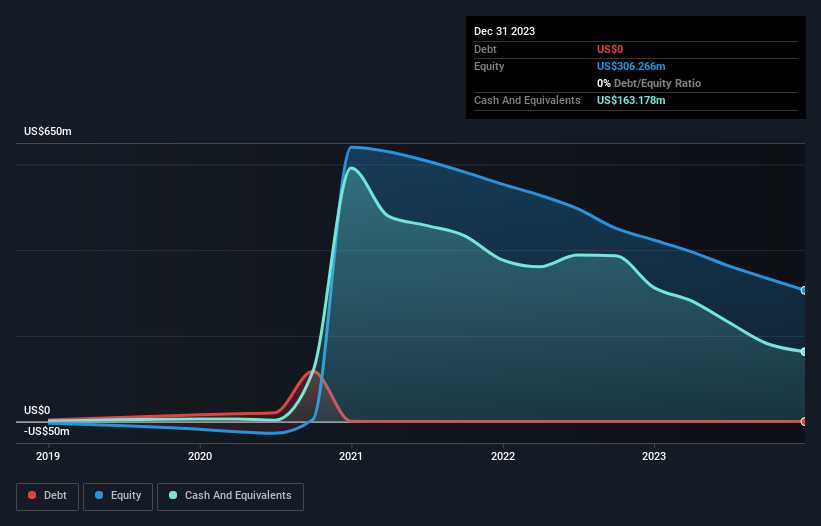
A company's cash runway is calculated by dividing its cash hoard by its cash burn. In December 2023, Hyliion Holdings had US$163m in cash, and was debt-free. In the last year, its cash burn was US$124m. That means it had a cash runway of around 16 months as of December 2023. That's not too bad, but it's fair to say the end of the cash runway is in sight, unless cash burn reduces drastically. Depicted below, you can see how its cash holdings have changed over time.
How Is Hyliion Holdings' Cash Burn Changing Over Time?
Whilst it's great to see that Hyliion Holdings has already begun generating revenue from operations, last year it only produced US$672k, so we don't think it is generating significant revenue, at this point. As a result, we think it's a bit early to focus on the revenue growth, so we'll limit ourselves to looking at how the cash burn is changing over time. As it happens, the company's cash burn reduced by 7.3% over the last year, which suggests that management are maintaining a fairly steady rate of business development, albeit with a slight decrease in spending. While the past is always worth studying, it is the future that matters most of all. For that reason, it makes a lot of sense to take a look at our analyst forecasts for the company.
How Easily Can Hyliion Holdings Raise Cash?
While Hyliion Holdings is showing a solid reduction in its cash burn, it's still worth considering how easily it could raise more cash, even just to fuel faster growth. Issuing new shares, or taking on debt, are the most common ways for a listed company to raise more money for its business. One of the main advantages held by publicly listed companies is that they can sell shares to investors to raise cash and fund growth. By comparing a company's annual cash burn to its total market capitalisation, we can estimate roughly how many shares it would have to issue in order to run the company for another year (at the same burn rate).
Since it has a market capitalisation of US$273m, Hyliion Holdings' US$124m in cash burn equates to about 46% of its market value. That's high expenditure relative to the value of the entire company, so if it does have to issue shares to fund more growth, that could end up really hurting shareholders returns (through significant dilution).
How Risky Is Hyliion Holdings' Cash Burn Situation?
Even though its cash burn relative to its market cap makes us a little nervous, we are compelled to mention that we thought Hyliion Holdings' cash runway was relatively promising. Summing up, we think the Hyliion Holdings' cash burn is a risk, based on the factors we mentioned in this article. Separately, we looked at different risks affecting the company and spotted 4 warning signs for Hyliion Holdings (of which 2 are a bit concerning!) you should know about.
Of course, you might find a fantastic investment by looking elsewhere. So take a peek at this free list of interesting companies, and this list of stocks growth stocks (according to analyst forecasts)
Have feedback on this article? Concerned about the content? Get in touch with us directly. Alternatively, email editorial-team (at) simplywallst.com.
This article by Simply Wall St is general in nature. We provide commentary based on historical data and analyst forecasts only using an unbiased methodology and our articles are not intended to be financial advice. It does not constitute a recommendation to buy or sell any stock, and does not take account of your objectives, or your financial situation. We aim to bring you long-term focused analysis driven by fundamental data. Note that our analysis may not factor in the latest price-sensitive company announcements or qualitative material. Simply Wall St has no position in any stocks mentioned.
