We're Not Very Worried About Stitch Fix's (NASDAQ:SFIX) Cash Burn Rate
Even when a business is losing money, it's possible for shareholders to make money if they buy a good business at the right price. For example, although software-as-a-service business Salesforce.com lost money for years while it grew recurring revenue, if you held shares since 2005, you'd have done very well indeed. Having said that, unprofitable companies are risky because they could potentially burn through all their cash and become distressed.
Given this risk, we thought we'd take a look at whether Stitch Fix (NASDAQ:SFIX) shareholders should be worried about its cash burn. In this report, we will consider the company's annual negative free cash flow, henceforth referring to it as the 'cash burn'. We'll start by comparing its cash burn with its cash reserves in order to calculate its cash runway.
See our latest analysis for Stitch Fix
How Long Is Stitch Fix's Cash Runway?
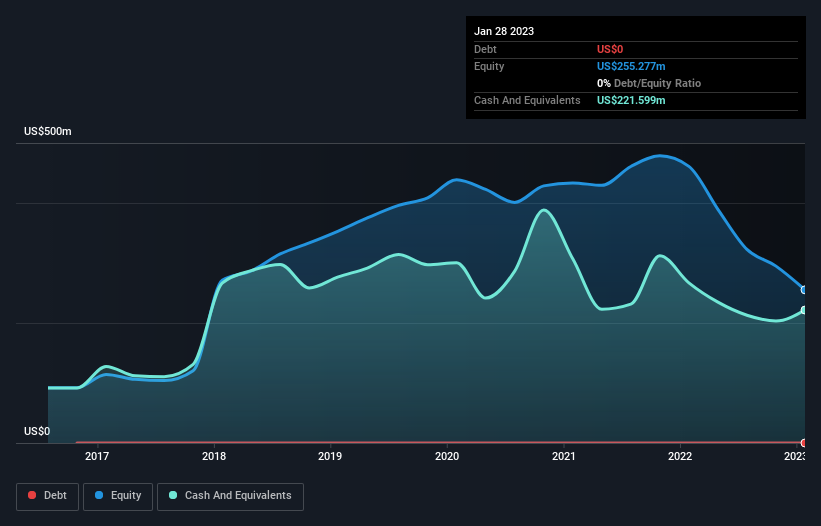
You can calculate a company's cash runway by dividing the amount of cash it has by the rate at which it is spending that cash. In January 2023, Stitch Fix had US$222m in cash, and was debt-free. In the last year, its cash burn was US$86m. Therefore, from January 2023 it had 2.6 years of cash runway. Notably, analysts forecast that Stitch Fix will break even (at a free cash flow level) in about 4 years. That means unless the company reduces its cash burn quickly, it may well look to raise more cash. The image below shows how its cash balance has been changing over the last few years.
Is Stitch Fix's Revenue Growing?
Given that Stitch Fix actually had positive free cash flow last year, before burning cash this year, we'll focus on its operating revenue to get a measure of the business trajectory. Regrettably, the company's operating revenue moved in the wrong direction over the last twelve months, declining by 16%. While the past is always worth studying, it is the future that matters most of all. For that reason, it makes a lot of sense to take a look at our analyst forecasts for the company.
How Hard Would It Be For Stitch Fix To Raise More Cash For Growth?
Given its problematic fall in revenue, Stitch Fix shareholders should consider how the company could fund its growth, if it turns out it needs more cash. Generally speaking, a listed business can raise new cash through issuing shares or taking on debt. Commonly, a business will sell new shares in itself to raise cash and drive growth. By comparing a company's annual cash burn to its total market capitalisation, we can estimate roughly how many shares it would have to issue in order to run the company for another year (at the same burn rate).
Since it has a market capitalisation of US$316m, Stitch Fix's US$86m in cash burn equates to about 27% of its market value. That's not insignificant, and if the company had to sell enough shares to fund another year's growth at the current share price, you'd likely witness fairly costly dilution.
Is Stitch Fix's Cash Burn A Worry?
Even though its falling revenue makes us a little nervous, we are compelled to mention that we thought Stitch Fix's cash runway was relatively promising. Shareholders can take heart from the fact that analysts are forecasting it will reach breakeven. While we're the kind of investors who are always a bit concerned about the risks involved with cash burning companies, the metrics we have discussed in this article leave us relatively comfortable about Stitch Fix's situation. Taking an in-depth view of risks, we've identified 3 warning signs for Stitch Fix that you should be aware of before investing.
If you would prefer to check out another company with better fundamentals, then do not miss this free list of interesting companies, that have HIGH return on equity and low debt or this list of stocks which are all forecast to grow.
Have feedback on this article? Concerned about the content? Get in touch with us directly. Alternatively, email editorial-team (at) simplywallst.com.
This article by Simply Wall St is general in nature. We provide commentary based on historical data and analyst forecasts only using an unbiased methodology and our articles are not intended to be financial advice. It does not constitute a recommendation to buy or sell any stock, and does not take account of your objectives, or your financial situation. We aim to bring you long-term focused analysis driven by fundamental data. Note that our analysis may not factor in the latest price-sensitive company announcements or qualitative material. Simply Wall St has no position in any stocks mentioned.
Join A Paid User Research Session
You’ll receive a US$30 Amazon Gift card for 1 hour of your time while helping us build better investing tools for the individual investors like yourself. Sign up here
