WESCO International's (NYSE:WCC) three-year earnings growth trails the 63% YoY shareholder returns
For us, stock picking is in large part the hunt for the truly magnificent stocks. You won't get it right every time, but when you do, the returns can be truly splendid. For example, the WESCO International, Inc. (NYSE:WCC) share price is up a whopping 330% in the last three years, a handsome return for long term holders. It's also good to see the share price up 46% over the last quarter.
The past week has proven to be lucrative for WESCO International investors, so let's see if fundamentals drove the company's three-year performance.
See our latest analysis for WESCO International
There is no denying that markets are sometimes efficient, but prices do not always reflect underlying business performance. By comparing earnings per share (EPS) and share price changes over time, we can get a feel for how investor attitudes to a company have morphed over time.
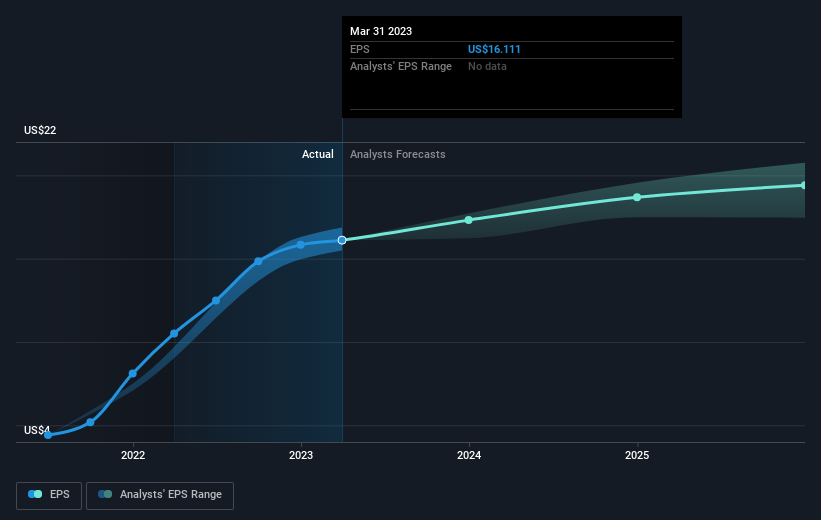
During three years of share price growth, WESCO International achieved compound earnings per share growth of 46% per year. In comparison, the 63% per year gain in the share price outpaces the EPS growth. This indicates that the market is feeling more optimistic on the stock, after the last few years of progress. That's not necessarily surprising considering the three-year track record of earnings growth.
The company's earnings per share (over time) is depicted in the image below (click to see the exact numbers).
It is of course excellent to see how WESCO International has grown profits over the years, but the future is more important for shareholders. This free interactive report on WESCO International's balance sheet strength is a great place to start, if you want to investigate the stock further.
What About Dividends?
When looking at investment returns, it is important to consider the difference between total shareholder return (TSR) and share price return. The TSR is a return calculation that accounts for the value of cash dividends (assuming that any dividend received was reinvested) and the calculated value of any discounted capital raisings and spin-offs. So for companies that pay a generous dividend, the TSR is often a lot higher than the share price return. In the case of WESCO International, it has a TSR of 332% for the last 3 years. That exceeds its share price return that we previously mentioned. This is largely a result of its dividend payments!
A Different Perspective
We're pleased to report that WESCO International shareholders have received a total shareholder return of 39% over one year. Of course, that includes the dividend. That's better than the annualised return of 25% over half a decade, implying that the company is doing better recently. Someone with an optimistic perspective could view the recent improvement in TSR as indicating that the business itself is getting better with time. I find it very interesting to look at share price over the long term as a proxy for business performance. But to truly gain insight, we need to consider other information, too. Case in point: We've spotted 1 warning sign for WESCO International you should be aware of.
If you would prefer to check out another company -- one with potentially superior financials -- then do not miss this free list of companies that have proven they can grow earnings.
Please note, the market returns quoted in this article reflect the market weighted average returns of stocks that currently trade on American exchanges.
Have feedback on this article? Concerned about the content? Get in touch with us directly. Alternatively, email editorial-team (at) simplywallst.com.
This article by Simply Wall St is general in nature. We provide commentary based on historical data and analyst forecasts only using an unbiased methodology and our articles are not intended to be financial advice. It does not constitute a recommendation to buy or sell any stock, and does not take account of your objectives, or your financial situation. We aim to bring you long-term focused analysis driven by fundamental data. Note that our analysis may not factor in the latest price-sensitive company announcements or qualitative material. Simply Wall St has no position in any stocks mentioned.
