West Red Lake Gold Intersects 10.92 g/t Au over 2.4m, 11.07 g/t Au over 2.15m and 38.15 g/t Au over 0.5m at Rowan Mine

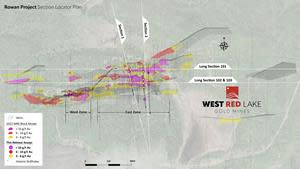
Rowan Project Section Locator Plan
Section 1: Looking West
![FIGURE 2. Rowan Mine drill section showing assay highlights for Holes RLG-23-167 and 168[1].](https://s.yimg.com/ny/api/res/1.2/EHiaCX4mz4x5qL543JaSRQ--/YXBwaWQ9aGlnaGxhbmRlcjt3PTQyMDtoPTIzNw--/https://media.zenfs.com/en/globenewswire.com/d2209268ec8d425ce3d5fbc6faeab74c)
Section 2: Looking West
![FIGURE 3. Rowan Mine drill section showing assay highlights for Holes RLG-23-170, 171 and 172[1].](https://s.yimg.com/ny/api/res/1.2/BgYt3jbVWzRiWsqgrvbXIA--/YXBwaWQ9aGlnaGxhbmRlcjt3PTQyMDtoPTIzNw--/https://media.zenfs.com/en/globenewswire.com/29f2fa71d80b1b63edc0ea88d69c7b91)
Vein 101 Long Section Looking North
![FIGURE 4. Rowan Mine longitudinal section for Vein 101 showing 2023 intercepts > 3 g/t Au. Assay highlights from current press release shown in red[1].](https://s.yimg.com/ny/api/res/1.2/WQo5tOUbVvBEsdaTfG5OOw--/YXBwaWQ9aGlnaGxhbmRlcjt3PTQyMDtoPTIzNw--/https://media.zenfs.com/en/globenewswire.com/1c86e9b2e2df115936a3aca41bd28c16)
Vein 102 Long Section Looking North
![FIGURE 5. Rowan Mine longitudinal section for Vein 102 showing 2023 intercepts > 3 g/t Au. Assay highlights from current press release shown in red[1].](https://s.yimg.com/ny/api/res/1.2/UibZmKhDAS.J2x8omEpaUQ--/YXBwaWQ9aGlnaGxhbmRlcjt3PTQyMDtoPTIzNw--/https://media.zenfs.com/en/globenewswire.com/7e803d3526737766b4cc52e579a7d445)
Vein 103 Long Section Looking North
![FIGURE 6. Rowan Mine longitudinal section for Vein 103 showing 2023 intercepts > 3 g/t Au. Assay highlights from current press release shown in red[1].](https://s.yimg.com/ny/api/res/1.2/4bmstvz9cxiWS2HSnMLj6Q--/YXBwaWQ9aGlnaGxhbmRlcjt3PTQyMDtoPTIzNw--/https://media.zenfs.com/en/globenewswire.com/8149c6890e801f6eb51cc66fce934479)
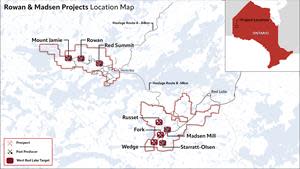
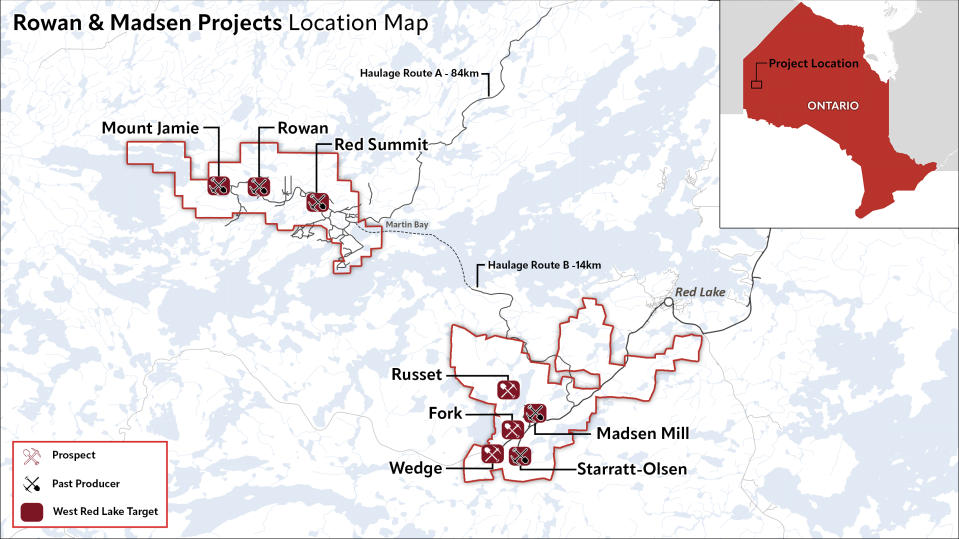
Rowan & Madsen Projects Location Map
VANCOUVER, British Columbia, Nov. 09, 2023 (GLOBE NEWSWIRE) -- West Red Lake Gold Mines Ltd. (“West Red Lake Gold” or “WRLG” or the “Company”) (TSXV: WRLG) (OTCQB: WRLGF) is pleased to report additional drill results from its 100% owned Rowan Property located in the prolific Red Lake Gold District of Northwestern Ontario, Canada.
Notably, Holes RLG-23-171 and RLG-23-172 represent the deepest intercepts drilled to date on Vein 101 within the high-grade East Zone.
This high-grade ore chute has been defined over an impressive strike length of approximately 250m and has now been drilled down to a vertical depth of 490m from surface, and still remains wide open at depth. Hole RLG-23-171 also intercepted 0.8m @ 19.82 g/t Au in a new sub-parallel vein running south of the currently modelled Rowan vein system, pointing to the discovery potential that still exists at Rowan. Furthermore, high-grade intercepts encountered in hole RLG-23-168 on Vein 101 were drilled outside of the December 2022 mineral resource domains indicating growth potential along strike to the west, outside of the existing resource.
HIGHLIGHTS:
Hole RLG-23-171 Intersected 2.4m @ 10.92 g/t Au, from 562.35m to 564.75m, Including 0.5m @ 48.30 g/t Au, from 564.25m to 564.75m; and 0.8m @ 19.82 g/t Au, from 147.2m to 148m.
Hole RLG-23-172 Intersected 2.15m @ 11.07 g/t Au, from 443.60m to 445.75m, Including 0.5m @ 45.90 g/t Au, from 444.70m to 445.20m.
Hole RLG-23-168 Intersected 0.5m @ 38.15 g/t Au, from 229.75m to 230.25m
Shane Williams, President & CEO, stated, “With this latest round of Rowan drill results, we have now successfully extended mineralization in the high-grade East Zone down to a vertical depth of 490m. If the Red Lake District has taught us anything, it’s that these zones can continue to depths exceeding 4km when the structural and geologic conditions are right. The Rowan Mine target has consistently demonstrated it has what it takes to produce high-grade gold intercepts over significant widths, and we look forward to continuing to drill and grow this exceptional resource along strike and at depth.”
The high-grade mineralized vein zones encountered at the Rowan Mine target area (the “Rowan Mine Target”) continue to exceed expectations, confirm the geologic model, and further improve the existing high-grade (9.2 g/t Au) 827,462 ounce Inferred Mineral Resource at the Rowan Mine. Sections for the Rowan Mine drilling outlined in this release are provided in Figures 1 through 6.
A total of 52 diamond drill holes for 18,990m have been completed so far in 2023 at the Rowan Mine target. Fire and metallic screen assays have been returned for 45 out of 52 holes completed, with 1 hole having partial assay results and 6 holes pending assays and QAQC.
TABLE 1. Significant intercepts (>3 g/t Au) from drilling at Rowan Mine Target.
Hole ID | Target | Zone | From (m) | To (m) | Thick (m)* | Au (g/t) |
RLG-23-167 | Rowan Mine | V102 (hw) | 170.00 | 174.00 | 4.00 | 3.41 |
Incl. | Rowan Mine | 170.00 | 171.10 | 1.10 | 6.60 | |
AND | Rowan Mine | V102 | 180.30 | 180.80 | 0.50 | 12.18 |
AND | Rowan Mine | V100 | 267.00 | 267.50 | 0.50 | 5.76 |
RLG-23-168 | Rowan Mine | V103 | 125.40 | 126.00 | 0.60 | 3.30 |
AND | Rowan Mine | V102 (hw) | 154.50 | 155.05 | 0.55 | 4.39 |
AND | Rowan Mine | V101 | 229.75 | 230.25 | 0.50 | 38.15 |
AND | Rowan Mine | V100 | 253.00 | 253.50 | 0.50 | 6.44 |
RLG-23-170 | Rowan Mine | V103 (fw) | 318.00 | 319.00 | 1.00 | 4.45 |
AND | Rowan Mine | V102 | 370.00 | 372.00 | 2.00 | 3.66 |
Incl. | Rowan Mine | 370.00 | 371.00 | 1.00 | 6.78 | |
AND | Rowan Mine | V101 | 469.00 | 471.00 | 2.00 | 5.64 |
Incl. | Rowan Mine | 470.00 | 471.00 | 1.00 | 9.13 | |
RLG-23-171 | Rowan Mine | NEW | 147.20 | 148.00 | 0.80 | 19.82 |
AND | Rowan Mine | V103 | 370.50 | 372.00 | 1.50 | 3.77 |
Incl. | Rowan Mine | 371.00 | 372.00 | 1.00 | 5.27 | |
AND | Rowan Mine | V102 | 440.00 | 444.00 | 4.00 | 3.93 |
Incl. | Rowan Mine | 442.00 | 442.50 | 0.50 | 10.74 | |
AND | Rowan Mine | V101 | 562.35 | 564.75 | 2.40 | 10.92 |
Incl. | Rowan Mine | 564.25 | 564.75 | 0.50 | 48.30 | |
AND | Rowan Mine | V100 (fw) | 582.00 | 582.50 | 0.50 | 4.42 |
RLG-23-172 | Rowan Mine | V103 (fw) | 443.60 | 445.75 | 2.15 | 11.07 |
Incl. | Rowan Mine | 444.70 | 445.20 | 0.50 | 45.90 | |
AND | Rowan Mine | V101 | 602.35 | 602.85 | 0.50 | 6.28 |
| ||||||
*The “From-To” intervals in Table 1 are denoting overall downhole length of the intercept. True thickness has not been calculated for these intercepts but is expected to be ≥ 60% of downhole thickness based on intercept angles observed in the drill core. Under ‘Zone’ column, (hw) is indicating ‘hanging wall to’ and (fw) is indicating ‘footwall to’ main vein zones.
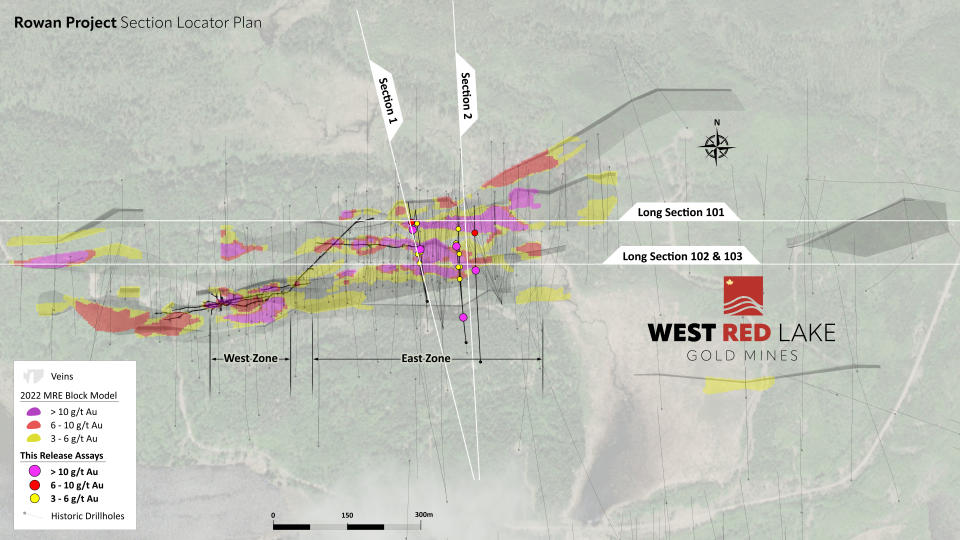
FIGURE 1. Deposit-scale plan map of Rowan Mine Target area showing traces and intercepts for holes highlighted in this News Release.
TABLE 2: Drill collar summary for holes reported in this News Release.
Hole ID | Target | Easting | Northing | Elev (m) | Length (m) | Azimuth | Dip |
RLG-23-167 | Rowan Mine | 422019 | 5657795 | 367 | 312 | 350 | -50 |
RLG-23-168 | Rowan Mine | 422019 | 5657795 | 367 | 312 | 348 | -45 |
RLG-23-170 | Rowan Mine | 422110 | 5657700 | 386 | 555 | 353 | -59 |
RLG-23-171 | Rowan Mine | 422110 | 5657700 | 386 | 600 | 353 | -67 |
RLG-23-172 | Rowan Mine | 422143 | 5657654 | 378 | 712 | 356 | -66 |
| |||||||
DISCUSSION
The Rowan Mine Target consists of more than seven sub-parallel, near-vertical, east-west trending veins that are currently defined over a strike length of approximately 1.1 km– mineralization remains open along strike and at depth. The orientation of the veins at the Rowan Mine tend to follow the direction of D2 deformation, which is oriented in an east-west direction over this part of the property. Individual mineralized vein zones usually average 1.0 to 1.5m in thickness, with an overall thickness of the Rowan vein corridor at around 115m. Gold mineralization is typically localized within quartz-carbonate veins hosted within and along the ‘footwall’ margin of a porphyritic felsic intrusive, with increased grades often associated with the presence of visible gold and base metal sulphides (e.g. galena, sphalerite). High-grade dilation zones or ‘ore chutes’ along the Rowan vein trend have been recognized as important controls for localizing thicker and higher-grade zones of gold mineralization. The position and geometry of these dilation zones is well understood at Rowan.
The drilling completed at the Rowan Mine Target in 2023 has been focused on validating historical data across the Inferred Resource, and also infilling apparent gaps in the analytical data set which was a product of very selective sampling techniques implemented during previous drilling campaigns. Assay results received from the 2023 drilling program continue to confirm our thesis that quartz veining and gold mineralization continue at depth and along strike, with grades consistent with, or higher than those outlined in the current Inferred Mineral Resource which remains open in all directions. For example, the 100 Vein Zone - which is the furthest north vein currently modeled within the overall Rowan vein corridor - was previously interpreted to be a lower grade portion of the block model. Recent drilling has confirmed that higher grades are present within the 100 Vein Zone below 150m elevation, suggesting that gold grades are increasing at depth within this zone which is a trend that has been observed elsewhere in the Red Lake district. Drilling at the Rowan Mine Target area will continue with an emphasis on infill and expansion of the existing high-grade mineral resource.
High resolution versions of all the figures contained in this press release can be found at the following web address: https://westredlakegold.com/november-9th-news-release-maps/
Longitudinal sections showing all intercepts > 3 g/t Au on Veins 101, 102 and 103 can be viewed here: https://westredlakegold.com/august-1st-news-release-maps/.
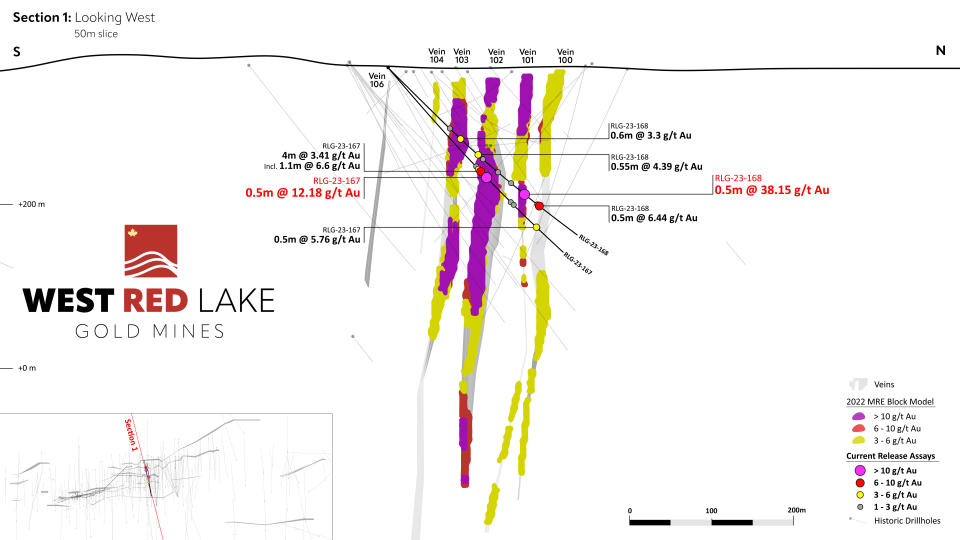
FIGURE 2. Rowan Mine drill section showing assay highlights for Holes RLG-23-167 and -168[1].

FIGURE 3. Rowan Mine drill section showing assay highlights for Holes RLG-23-170, -171 and -172[1].
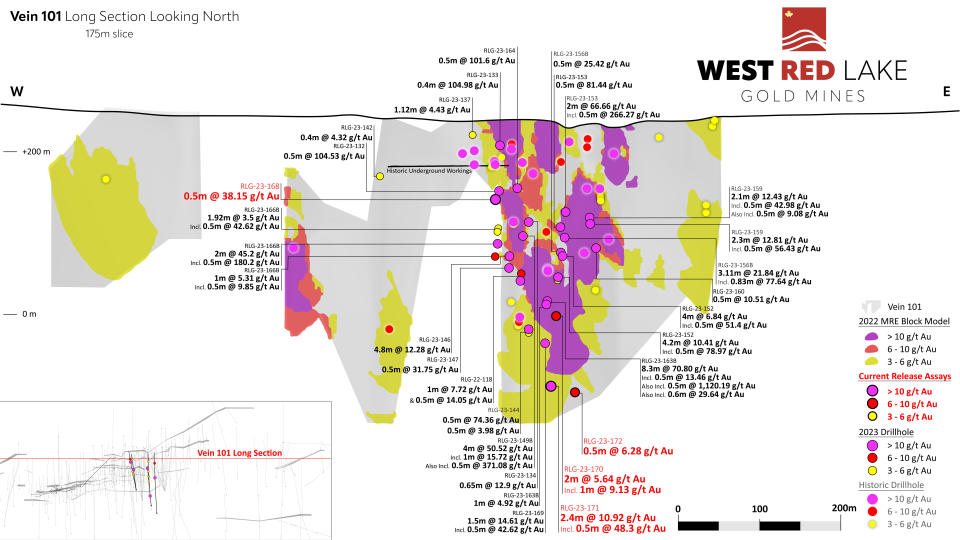
FIGURE 4. Rowan Mine longitudinal section for Vein 101 showing 2023 intercepts > 3 g/t Au. Assay highlights from current press release shown in red[1].

FIGURE 5. Rowan Mine longitudinal section for Vein 102 showing 2023 intercepts > 3 g/t Au. Assay highlights from current press release shown in red[1].
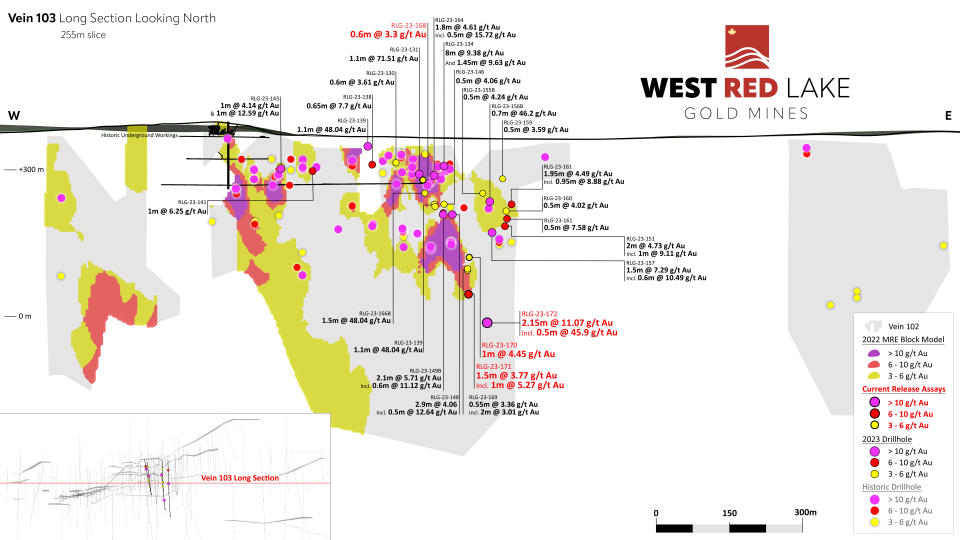
FIGURE 6. Rowan Mine longitudinal section for Vein 103 showing 2023 intercepts > 3 g/t Au. Assay highlights from current press release shown in red[1].
QUALITY ASSURANCE/QUALITY CONTROL
Drilling completed at the Rowan Property consists of oriented NQ-sized diamond drill core. All drill holes are systematically logged, photographed, and sampled by a trained geologist at WRLG’s Mt. Jamie core processing facility. Minimum allowable sample length is 0.5m. Maximum allowable sample length is 1.5m. Standard reference materials and blanks are inserted at a targeted 5% insertion rate. The drill core is then cut lengthwise utilizing a diamond blade core saw along a line pre-selected by the geologist. To reduce sampling bias, the same side of drill core is sampled consistently utilizing the orientation line as reference. For those samples containing visible gold (“VG”), a trained geologist supervises the cutting/bagging of those samples, and ensures the core saw blade is ‘cleaned’ with a dressing stone following the VG sample interval. Bagged samples are then sealed with zip ties and transported by WRLG personnel directly to SGS Natural Resource’s Facility in Red Lake, Ontario for assay.
Samples are then prepped by SGS, which consists of drying at 105°C and crushing to 75% passing 2mm. A riffle splitter is then utilized to produce a 500g course reject for archive. The remainder of the sample is then pulverized to 85% passing 75 microns from which 50g is analyzed by fire assay and an atomic absorption spectroscopy (AAS) finish. Samples returning gold values > 10 g/t Au are reanalyzed by fire assay with a gravimetric finish on a 50g sample. Samples with visible gold are also analyzed via metallic screen analysis (SGS code: GO_FAS50M). For multi-element analysis, samples are sent to SGS’s facility in Burnaby, British Columbia and analyzed via four-acid digest with an atomic emission spectroscopy (ICP-AES) finish for 33-element analysis on 0.25g sample pulps (SGS code: GE_ICP40Q12). SGS Natural Resources analytical laboratories operates under a Quality Management System that complies with ISO/IEC 17025.
West Red Lake Gold’s Rowan Property presently hosts a National Instrument 43-101 (“NI 43-101”) Inferred Mineral Resource of 2,790,700 t at an average grade of 9.2 g/t Au containing 827,462 ounces of gold with a cut-off grade of 3.8 g/t Au (NI 43-101 Technical Report, entitled “Technical Report and Resource Estimate on the West Red Lake Project” authored by John Kita, P.Eng., dated December 13, 2022 and filed December 30, 2022 on www.sedar.com). The Inferred Mineral Resource is located in the area of the historic underground Rowan Mine site and situated within a 1.8 km strike length portion of the regional scale Pipestone Bay St Paul Deformation Zone.
The technical information presented in this news release has been reviewed and approved by Will Robinson, P.Geo., Vice President of Exploration for West Red Lake Gold and the Qualified Person for exploration at the West Red Lake Project, as defined by NI 43-101 “Standards of Disclosure for Mineral Projects”.
INVESTOR RELATIONS AGREEMENT
The Company has entered into an agreement with Triomphe Holdings Ltd. (dba Capital Analytica) (“Capital Analytica”) for investor relations and communication services (the “Consulting Agreement”). The Consulting Agreement has an initial term of six months, commencing November 1, 2023 under which the Company will pay to Capital Analytica an aggregate of $120,000 at a rate of $20,000 per month, and has an option to renew the Consulting Agreement for an additional 6 months at a rate of $10,000 per month, unless terminated earlier in accordance with the Consulting Agreement.
Pursuant to the terms of the Consulting Agreement, Capital Analytica will provide ongoing capital markets consultation, ongoing social media consultation regarding engagement and enhancement, social sentiment reporting, social engagement reporting, discussion forum monitoring and reporting, corporate video dissemination, and other related investor relations services.
Capital Analytica is a Nanaimo based company owned and operated by Jeff French who is arms length to the Company and holds no securities, directly or indirectly of the Company.
ABOUT WEST RED LAKE GOLD MINES
West Red Lake Gold Mines Ltd. is a mineral exploration company that is publicly traded and focused on advancing and developing its flagship Madsen Gold Mine and the associated 47 km2 highly prospective land package in the Red Lake district of Ontario. The highly productive Red Lake Gold District of Northwest Ontario, Canada has yielded over 30 million ounces of gold from high-grade zones and hosts some of the world’s richest gold deposits. WRLG also holds the wholly owned Rowan Property in Red Lake, with an expansive property position covering 31 km2 including three past producing gold mines - Rowan, Mount Jamie, and Red Summit.
ON BEHALF OF WEST RED LAKE GOLD MINES LTD.
“Shane Williams”
Shane Williams
President & Chief Executive Officer
FOR FURTHER INFORMATION, PLEASE CONTACT:
Amandip Singh, VP Corporate Development
Tel: 416-203-9181
Email: investors@westredlakegold.com or visit the Company’s website at https://www.westredlakegold.com
Neither the TSX Venture Exchange nor its Regulation Services Provider (as that term is defined in the policies of the TSX Venture Exchange) accepts responsibility for the adequacy or accuracy of this release.
Certain statements contained in this news release constitute "forward-looking statements". When used in this document, the words "anticipated", "expect", "estimated", "forecast", "planned", and similar expressions are intended to identify forward-looking statements or information. These statements are based on current expectations of management, however, they are subject to known and unknown risks, uncertainties and other factors that may cause actual results to differ materially from the forward-looking statements in this news release and include without limitation, statements relating to the Rowan Property potential and the Company’s future objectives and plans. Readers are cautioned not to place undue reliance on these statements. West Red Lake Gold Mines Ltd. does not undertake any obligation to revise or update any forward- looking statements as a result of new information, future events or otherwise after the date hereof, except as required by securities laws.
Forward‐looking statements involve numerous risks and uncertainties and actual results might differ materially from results suggested in any forward-looking statements. These risks and uncertainties include, among other things, market volatility; the state of the financial markets for the Company’s securities; fluctuations in commodity prices and changes in the Company’s business plans. In making the forward looking statements in this news release, the Company has applied several material assumptions that the Company believes are reasonable, including without limitation, that the Company will continue with its stated business objectives and its ability to raise additional capital to proceed. Although management of the Company has attempted to identify important factors that could cause actual results to differ materially from those contained in forward-looking statements or forward-looking information, there may be other factors that cause results not to be as anticipated, estimated or intended. There can be no assurance that such statements will prove to be accurate, as actual results and future events could differ materially from those anticipated in such statements. Accordingly, readers should not place undue reliance on forward-looking statements and forward-looking information. Readers are cautioned that reliance on such information may not be appropriate for other purposes. The Company does not undertake to update any forward-looking statement, forward-looking information or financial out-look that are incorporated by reference herein, except in accordance with applicable securities laws. The Company seeks safe harbor.
For more information on the Company, investors should review the Company’s continuous disclosure filings that are available at www.sedarplus.ca.
1 Mineral Resources are estimated at a cut-off grade of 9.2 g/t Au and using a gold price of US$1,600/oz. Please refer to the technical report entitled “Technical Report and Resource Estimate on the West Red Lake Project” dated December 13, 2022 prepared for WRLG by John Kita, P.Eng., and filed December 30, 2022 on www.sedarplus.ca.
Photos accompanying this announcement are available at:
https://www.globenewswire.com/NewsRoom/AttachmentNg/b645b3a5-af61-4e61-a234-1105414195a7
https://www.globenewswire.com/NewsRoom/AttachmentNg/11fdea06-1e59-4d89-a9f8-11158c0634db
https://www.globenewswire.com/NewsRoom/AttachmentNg/fcf19611-8674-4d8b-8f1f-c748330d1153
https://www.globenewswire.com/NewsRoom/AttachmentNg/757f6d02-40f8-40b5-9205-1792b874f3c2
https://www.globenewswire.com/NewsRoom/AttachmentNg/6bec3a6a-5381-4ed6-9f61-14ef654e5d1d
https://www.globenewswire.com/NewsRoom/AttachmentNg/0499f0c9-1765-4aac-a953-a5c09b311763
https://www.globenewswire.com/NewsRoom/AttachmentNg/ae6f9bba-159e-4ff7-a6cb-b0b86cbd8dd6

