West Red Lake Gold Reports Final 2023 Drill Results from Rowan and Highlights 2023 Exploration Achievements

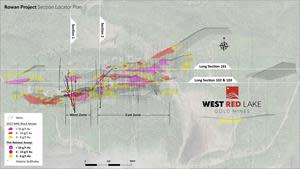
Rowan Project Section Location Plan
Section 1: Looking West
![Figure 2. Rowan Mine drill section showing assay highlights for Holes RLG-23-176c and -177 through -186[1]](https://s.yimg.com/ny/api/res/1.2/7.rW6PqaqD_esKX2G4BD2Q--/YXBwaWQ9aGlnaGxhbmRlcjt3PTQyMDtoPTIzNw--/https://media.zenfs.com/en/globenewswire.com/d1a8009f714f54741a7355c4296c00d2)
Section 2: Looking West
![Figure 3. Rowan Mine drill section showing assay highlights for Holes RLG-23-173, -174 and -175[1]](https://s.yimg.com/ny/api/res/1.2/EdiDqzPvTNDUdI_cHPIJHw--/YXBwaWQ9aGlnaGxhbmRlcjt3PTQyMDtoPTIzNw--/https://media.zenfs.com/en/globenewswire.com/f391015303d4d36defc8b5053dbea5df)
Vein 101 Long Section Looking North
![FIGURE 4. Rowan Mine longitudinal section for Vein 101 showing 2023 intercepts > 3 g/t Au. Assay highlights from current press release shown in red[1]](https://s.yimg.com/ny/api/res/1.2/EHCoKLeWAQnP0o9ZI4k89g--/YXBwaWQ9aGlnaGxhbmRlcjt3PTQyMDtoPTIzNw--/https://media.zenfs.com/en/globenewswire.com/68f97a975a7d6b7eac9619e6f493f0a2)
Vein 102 Long Section Looking North
![FIGURE 5. Rowan Mine longitudinal section for Vein 102 showing 2023 intercepts > 3 g/t Au. Assay highlights from current press release shown in red [1]](https://s.yimg.com/ny/api/res/1.2/S7_ijtVhmZM3q3IuI2Ckhw--/YXBwaWQ9aGlnaGxhbmRlcjt3PTQyMDtoPTIzNw--/https://media.zenfs.com/en/globenewswire.com/042bfb9e35d87b4717dd8879caeaea37)
Vein 103 Long Section Looking North
![FIGURE 6. Rowan Mine longitudinal section for Vein 103 showing 2023 intercepts > 3 g/t Au. Assay highlights from current press release shown in red[1]](https://s.yimg.com/ny/api/res/1.2/MwEL4FVYzOtHUV7QKokqjg--/YXBwaWQ9aGlnaGxhbmRlcjt3PTQyMDtoPTIzNw--/https://media.zenfs.com/en/globenewswire.com/479ca41c44173aad7e7f994c1e4c846b)
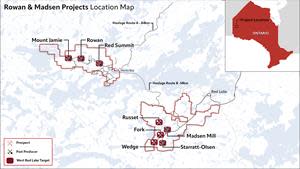
Rowan & Madsen Projects Location Map
VANCOUVER, British Columbia, Jan. 17, 2024 (GLOBE NEWSWIRE) -- West Red Lake Gold Mines Ltd. (“West Red Lake Gold” or “WRLG” or the “Company”) (TSXV: WRLG) (OTCQB: WRLGF) is pleased to report final drill results from the 2023 drilling campaign at its 100% owned Rowan Property located in the prolific Red Lake Gold District of Northwestern Ontario, Canada.
The Rowan drill holes highlighted in this news release were focused on infilling gaps in the geologic model between the East and West Zones, as well as infill and expansion at depth on the West Zone ore shoot. Most of the historic production at the Rowan Mine was from the West ore shoot area - mainly concentrated on Veins 103 & 104. Notably, hole RLG-23-177 was successful in intercepting 4.0m @ 9.5 g/t Au approximately 80m beneath the historic workings, demonstrating the down-plunge potential that still exists in the West Zone.
HIGHLIGHTS:
Hole RLG-23-177 Intersected 4.0m @ 9.5 g/t Au, from 212m to 216m, Including 0.75m @ 25.20 g/t Au, from 212m to 212.75m, Also including 1.1m @ 13.0 g/t Au, from 213.25m to 214.35m.
Hole RLG-23-175 Intersected 2.7m @ 3.66 g/t Au, from 211m to 213.7m, Including 0.7m @ 13.41 g/t Au, from 213m to 213.7m; And 3.6m @ 3.13 g/t Au, from 221m to 224.6m, Including 0.5m @ 20.01 g/t Au, from 223.6m to 224.1m; And 9.0m @ 3.25 g/t Au, from 255m to 264m, Including 0.5m @ 51.67 g/t Au, from 259.9m to 260.4m.
Hole RLG-23-174 Intersected 1.0m @ 12.21 g/t Au, from 185m to 186m; And 2.0m @ 10.84 g/t Au, from 406m to 408m, Including 0.5m @ 42.60 g/t Au, from 406m to 406.5m.
Hole RLG-23-179 Intersected 1.0m @ 16.19 g/t Au, from 420m to 421m, Including 0.5m @ 31.65 g/t Au, from 420.5m to 421m.
Hole RLG-23-180 Intersected 3.5m @ 3.22 g/t Au, from 92.5m to 96.0m, Including 0.55m @ 15.90 g/t Au, from 93.95m to 94.50m; And 2.0m @ 6.09 g/t Au, from 203m to 205m, Including 0.6m @ 19.99 g/t Au, from 203.7m to 204.3m.
Hole RLG-23-173 Intersected 0.5m @ 17.78 g/t Au, from 218.5m to 219m.
Hole RLG-23-176C Intersected 1.5m @ 3.93 g/t Au, from 281m to 282.5m, Including 0.5m @ 10.68 g/t Au, from 282m to 282.5m.
Shane Williams, President & CEO, stated, "We are very pleased to announce this final round of drill results from the 2023 exploration campaign at Rowan. The work completed at Rowan during 2023 was catalyst rich, and not only demonstrated the high-grade growth potential of the deposit, but also our commitment to sustainable exploration and development in Red Lake. Working towards a restart scenario at the Madsen Mine will remain the primary focus for our team in 2024, but we are also very excited about the exploration potential we see in the district and look forward to updating our shareholders on continued exploration successes and Company milestones throughout the year."
Sections for the Rowan Mine drilling outlined in this release are provided in Figures 1 through 6.
Rowan Property 2023 Exploration Achievements
Acquired remaining interest in the Rowan Property from Evolution Mining, bringing ownership to 100% (see press release dated March 9th)
Drilled a total of 62 holes for 20,211.4m of NQ diamond drill core at the Rowan Mine deposit – highlights announced from the 2023 drilling include:
70.80 g/t Au over 8.3m in hole RLG-23-163B (see press release dated September 12th)
50.52 g/t Au over 4.0m in hole RLG-23-149B (see press release dated August 1st)
66.66 g/t Au over 2.0m in hole RLG-23-153 (see press release dated August 29th)
45.20 g/t Au over 2.0m in hole RLG-23-166B (see press release dated October 11th)
10.34 g/t Au over 8.0m in hole RLG-23-134 (see press release dated May 23rd)
Positive metallurgical test results from Rowan Deposit indicating overall gold extraction above 98%, requiring only minor changes to the existing flowsheet at Madsen Mill (see press release dated November 15th).
Defined the high-grade East Zone ore shoot at Rowan down to 490m depth – still remains open for expansion below this level.
Drilled an additional 2 holes for 780m of NQ diamond drill core at the Red Summit NE target – results confirmed geologic thesis and warrant additional drilling in this area.
Conducted baseline orientation soil sampling survey - 344 sample sites focused on C-horizon material. Sampling grid covered prospective ground near Rowan and Mt Jamie mine sites and along trend of NT Zone. Assay results received and currently being evaluated.
Completed reprocessing of two airborne magnetic geophysical datasets and conducted a property-wide LiDAR survey including a corridor along the Mt Jamie access road for future engineering considerations.
Initiated baseline environmental and archaeological assessments to begin advancing the Rowan deposit towards an Advanced Exploration Permit to allow for collection of a bulk sample.
TABLE 1. Significant intercepts (>3 g/t Au) from drilling at Rowan Mine Target.
Hole ID | Target | Zone | From (m) | To (m) | Thick (m)* | Au (g/t) |
RLG-23-173 | Rowan Mine | V102 (hw) | 218.50 | 219.00 | 0.50 | 17.78 |
RLG-23-174 | Rowan Mine | V104 | 185.00 | 186.00 | 1.00 | 12.21 |
AND | Rowan Mine | V102 (hw) | 278.00 | 279.00 | 1.00 | 3.25 |
AND | Rowan Mine | V102 | 303.87 | 306.00 | 2.13 | 4.89 |
AND | Rowan Mine | V102 | 333.00 | 334.00 | 1.00 | 3.11 |
AND | Rowan Mine | V101 | 406.00 | 408.00 | 2.00 | 10.84 |
Incl. | 406.00 | 406.50 | 0.50 | 42.60 | ||
RLG-23-175 | Rowan Mine | V103 | 211.00 | 213.70 | 2.70 | 3.66 |
Incl. | 213.00 | 213.70 | 0.70 | 13.41 | ||
AND | Rowan Mine | V103 (fw) | 221.00 | 224.60 | 3.60 | 3.13 |
Incl. | 223.60 | 224.10 | 0.50 | 20.01 | ||
AND | Rowan Mine | V102 (hw) | 255.00 | 264.00 | 9.00 | 3.25 |
Incl. | 259.90 | 260.40 | 0.50 | 51.67 | ||
RLG-23-176C | Rowan Mine | V103 (fw) | 281.00 | 282.50 | 1.50 | 3.93 |
Incl. | 282.00 | 282.50 | 0.50 | 10.68 | ||
AND | Rowan Mine | V101 | 433.00 | 435.00 | 2.00 | 4.93 |
Incl. | 433.00 | 434.00 | 1.00 | 9.64 | ||
RLG-23-177 | Rowan Mine | V106 | 98.50 | 99.00 | 0.50 | 3.62 |
AND | Rowan Mine | V103 | 212.00 | 216.00 | 4.00 | 9.50 |
Incl. | 212.00 | 212.75 | 0.75 | 25.20 | ||
Also Incl. | 213.25 | 214.35 | 1.10 | 13.00 | ||
AND | Rowan Mine | V103 | 225.00 | 227.00 | 2.00 | 3.12 |
AND | Rowan Mine | V103 (fw) | 228.00 | 228.50 | 0.50 | 3.07 |
AND | Rowan Mine | V103 (fw) | 234.00 | 234.50 | 0.50 | 3.92 |
AND | Rowan Mine | V103 (fw) | 242.00 | 242.60 | 0.60 | 3.65 |
RLG-23-178 | Rowan Mine | V106 (hw) | 56.00 | 57.00 | 1.00 | 3.23 |
AND | Rowan Mine | V106 | 79.00 | 80.60 | 1.60 | 3.70 |
Incl. | 80.00 | 80.60 | 0.60 | 8.95 | ||
AND | Rowan Mine | V104 | 168.00 | 173.50 | 5.50 | 3.17 |
Incl. | 171.00 | 172.00 | 1.00 | 7.99 | ||
AND | Rowan Mine | V103 (fw) | 176.50 | 177.00 | 0.50 | 4.34 |
AND | Rowan Mine | V102 (fw) | 214.70 | 215.20 | 0.50 | 4.95 |
RLG-23-179 | Rowan Mine | V106 | 100.00 | 101.70 | 1.70 | 3.60 |
AND | Rowan Mine | V104 (hw) | 216.35 | 217.35 | 1.00 | 4.15 |
AND | Rowan Mine | V103 (fw) | 250.00 | 250.85 | 0.85 | 3.19 |
AND | Rowan Mine | V102 (hw) | 301.00 | 302.00 | 1.00 | 4.98 |
AND | Rowan Mine | V101 | 420.00 | 421.00 | 1.00 | 16.19 |
Incl. | 420.50 | 421.00 | 0.50 | 31.65 | ||
RLG-23-180 | Rowan Mine | V106 | 92.50 | 96.00 | 3.50 | 3.22 |
Incl. | Rowan Mine | 93.95 | 94.50 | 0.55 | 15.90 | |
AND | Rowan Mine | V104 (hw) | 167.00 | 168.00 | 1.00 | 6.12 |
AND | Rowan Mine | V103 (fw) | 203.00 | 205.00 | 2.00 | 6.09 |
Incl. | Rowan Mine | 203.70 | 204.30 | 0.60 | 19.99 | |
RLG-23-181 | Rowan Mine | No Assay Values > 3 g/t Au | ||||
RLG-23-182 | Rowan Mine | No Assay Values > 3 g/t Au | ||||
RLG-23-183 | Rowan Mine | No Assay Values > 3 g/t Au | ||||
RLG-23-184 | Rowan Mine | No Assay Values > 3 g/t Au | ||||
RLG-23-185 | Rowan Mine | V103 | 9.00 | 10.00 | 1.00 | 4.98 |
AND | Rowan Mine | V101 (hw) | 185.00 | 188.00 | 3.00 | 3.97 |
RLG-23-186 | Rowan Mine | No Assay Values > 3 g/t Au | ||||
*The “From-To” intervals in Table 1 are denoting overall downhole length of the intercept. True thickness has not been calculated for these intercepts but is expected to be ≥ 60% of downhole thickness based on intercept angles observed in the drill core. Under ‘Zone’ column, (hw) is indicating ‘hanging wall to’ and (fw) is indicating ‘footwall to’ main vein zones.
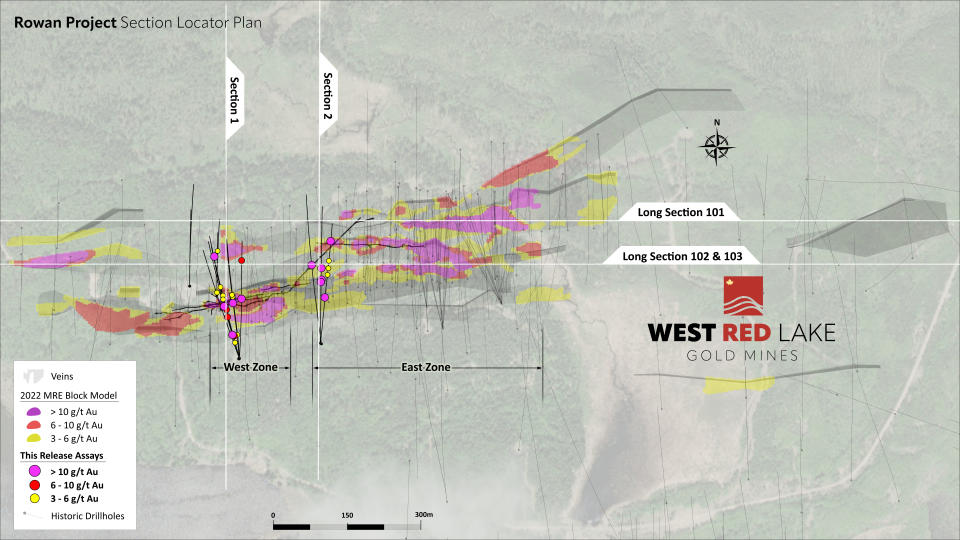
FIGURE 1. Deposit-scale plan map of Rowan Mine Target area showing traces and intercepts for holes highlighted in this News Release.
TABLE 2: Drill collar summary for holes reported in this News Release.
Hole ID | Target | Easting | Northing | Elev (m) | Length (m) | Azimuth | Dip |
RLG-23-173 | Rowan Mine | 421807 | 5657718 | 368 | 400 | 352 | -48 |
RLG-23-174 | Rowan Mine | 421804 | 5657719 | 367 | 474 | 8 | -62 |
RLG-23-175 | Rowan Mine | 421804 | 5657719 | 367 | 450 | 360 | -58 |
RLG-23-176C | Rowan Mine | 421640 | 5657688 | 368 | 507 | 3 | -69 |
RLG-23-177 | Rowan Mine | 421640 | 5657688 | 368 | 432 | 357 | -63 |
RLG-23-178 | Rowan Mine | 421640 | 5657689 | 368 | 408 | 344 | -63 |
RLG-23-179 | Rowan Mine | 421640 | 5657689 | 368 | 462 | 344 | -63 |
RLG-23-180 | Rowan Mine | 421640 | 5657689 | 368 | 450 | 343 | -60 |
RLG-23-181 | Rowan Mine | 421640 | 5657689 | 368 | 396 | 340 | -58 |
RLG-23-182 | Rowan Mine | 421540 | 5657835 | 402 | 333 | 1 | -71 |
RLG-23-183 | Rowan Mine | 421540 | 5657835 | 402 | 306 | 360 | -61 |
RLG-23-184 | Rowan Mine | 421540 | 5657835 | 402 | 309 | 360 | -51 |
RLG-23-185 | Rowan Mine | 421595 | 5657817 | 406 | 315 | 360 | -62 |
RLG-23-186 | Rowan Mine | 421595 | 5657817 | 406 | 222 | 360 | -57 |
DISCUSSION
The Rowan Mine deposit consists of more than seven sub-parallel, near-vertical, east-west trending veins that are currently defined over a strike length of approximately 1.1 km– mineralization remains open along strike and at depth. The orientation of the veins at the Rowan Mine tend to follow the direction of D2 deformation, which is oriented in an east-west direction over this part of the property. Individual mineralized vein zones usually average 1.0 to 1.5m in thickness, with an overall thickness of the Rowan vein corridor at around 115m. Gold mineralization is typically localized within quartz-carbonate veins hosted within and along the ‘footwall’ margin of a porphyritic felsic intrusive, with increased grades often associated with the presence of visible gold and base metal sulphides (e.g. galena, sphalerite). High-grade dilation zones or ‘ore chutes’ along the Rowan vein trend have been recognized as important controls for localizing thicker and higher-grade zones of gold mineralization. The position and geometry of these dilation zones is well understood at Rowan.
The drilling completed at the Rowan Mine Target in 2023 has been focused on validating historical data across the Inferred Resource, and also infilling apparent gaps in the analytical data set which was a product of very selective sampling techniques implemented during previous drilling campaigns. Assay results received from the 2023 drilling program continue to confirm our thesis that quartz veining and gold mineralization continue at depth and along strike, with grades consistent with, or higher than those outlined in the current Inferred Mineral Resource which remains open in all directions. Future drilling at the Rowan Mine Target area will continue with an emphasis on infill and expansion of the existing high-grade mineral resource.
High resolution versions of all the figures contained in this press release can be found at the following web address: https://westredlakegold.com/january-17th-news-release-maps/
Longitudinal sections showing all intercepts > 3 g/t Au on Veins 101, 102 and 103 can be viewed here: https://westredlakegold.com/august-1st-news-release-maps/.
FIGURE 2. Rowan Mine drill section showing assay highlights for Holes RLG-23-176c and -177 through -186[1].
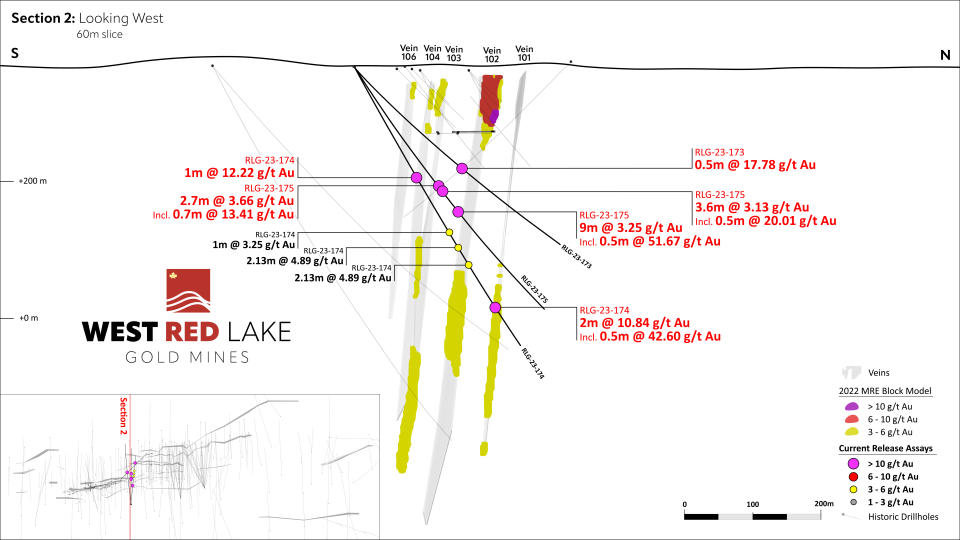
FIGURE 3. Rowan Mine drill section showing assay highlights for Holes RLG-23-173, -174 and -175[1].
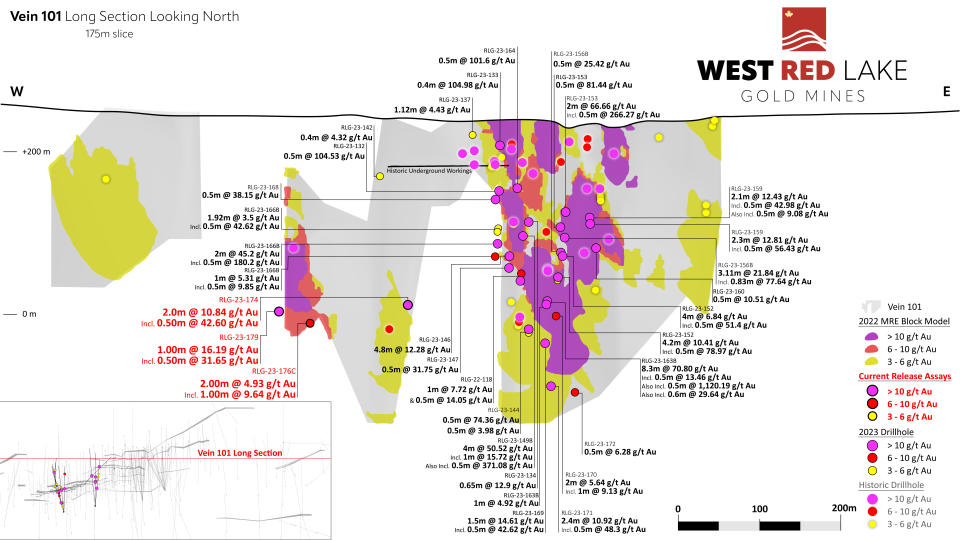
FIGURE 4. Rowan Mine longitudinal section for Vein 101 showing 2023 intercepts > 3 g/t Au. Assay highlights from current press release shown in red[1].`
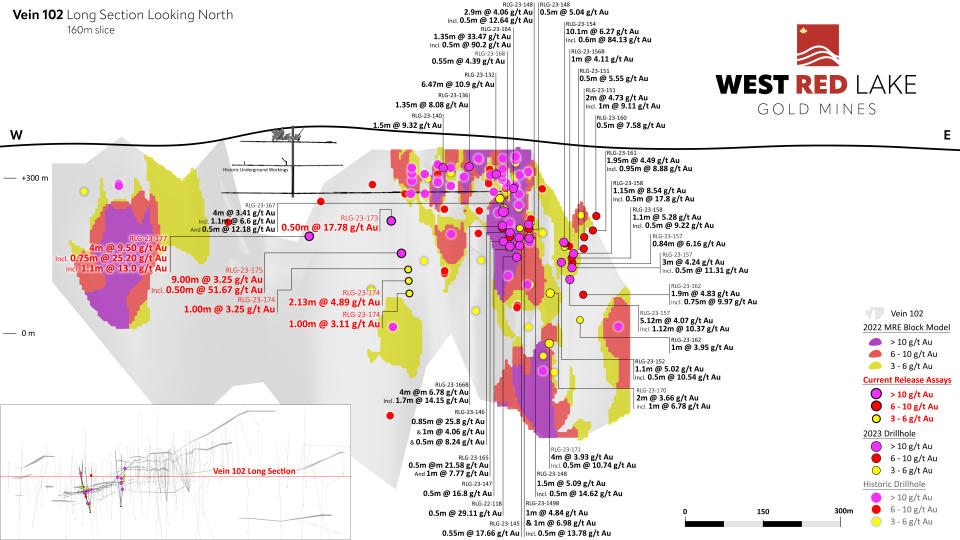
FIGURE 5. Rowan Mine longitudinal section for Vein 102 showing 2023 intercepts > 3 g/t Au. Assay highlights from current press release shown in red[1].
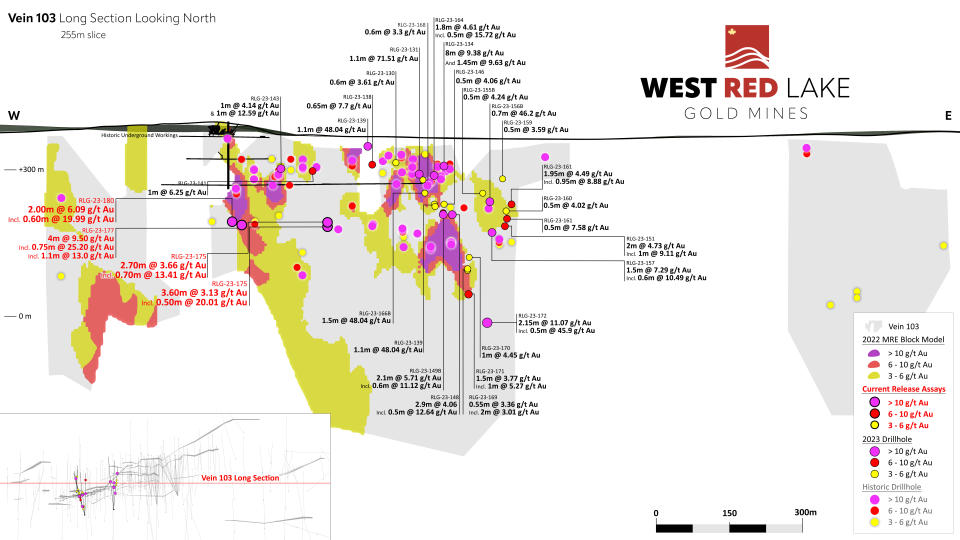
FIGURE 6. Rowan Mine longitudinal section for Vein 103 showing 2023 intercepts > 3 g/t Au. Assay highlights from current press release shown in red[1].
QUALITY ASSURANCE/QUALITY CONTROL
Drilling completed at the Rowan Property consists of oriented NQ-sized diamond drill core. All drill holes are systematically logged, photographed, and sampled by a trained geologist at WRLG’s Mt. Jamie core processing facility. Minimum allowable sample length is 0.5m. Maximum allowable sample length is 1.5m. Standard reference materials and blanks are inserted at a targeted 5% insertion rate. The drill core is then cut lengthwise utilizing a diamond blade core saw along a line pre-selected by the geologist. To reduce sampling bias, the same side of drill core is sampled consistently utilizing the orientation line as reference. For those samples containing visible gold (“VG”), a trained geologist supervises the cutting/bagging of those samples, and ensures the core saw blade is ‘cleaned’ with a dressing stone following the VG sample interval. Bagged samples are then sealed with zip ties and transported by WRLG personnel directly to SGS Natural Resource’s Facility in Red Lake, Ontario for assay.
Samples are then prepped by SGS, which consists of drying at 105°C and crushing to 75% passing 2mm. A riffle splitter is then utilized to produce a 500g course reject for archive. The remainder of the sample is then pulverized to 85% passing 75 microns from which 50g is analyzed by fire assay and an atomic absorption spectroscopy (AAS) finish. Samples returning gold values > 10 g/t Au are reanalyzed by fire assay with a gravimetric finish on a 50g sample. Samples with visible gold are also analyzed via metallic screen analysis (SGS code: GO_FAS50M). For multi-element analysis, samples are sent to SGS’s facility in Burnaby, British Columbia and analyzed via four-acid digest with an atomic emission spectroscopy (ICP-AES) finish for 33-element analysis on 0.25g sample pulps (SGS code: GE_ICP40Q12). SGS Natural Resources analytical laboratories operates under a Quality Management System that complies with ISO/IEC 17025.
West Red Lake Gold’s Rowan Property presently hosts a National Instrument 43-101 (“NI 43-101”) Inferred Mineral Resource of 2,790,700 t at an average grade of 9.2 g/t Au containing 827,462 ounces of gold with a cut-off grade of 3.8 g/t Au (NI 43-101 Technical Report, entitled “Technical Report and Resource Estimate on the West Red Lake Project” authored by John Kita, P.Eng., dated December 13, 2022 and filed December 30, 2022 on www.sedarplus.ca). The Inferred Mineral Resource is located in the area of the historic underground Rowan Mine site and situated within a 1.8 km strike length portion of the regional scale Pipestone Bay St Paul Deformation Zone.
The technical information presented in this news release has been reviewed and approved by Will Robinson, P.Geo., Vice President of Exploration for West Red Lake Gold and the Qualified Person for exploration at the West Red Lake Project, as defined by NI 43-101 “Standards of Disclosure for Mineral Projects”.
ABOUT WEST RED LAKE GOLD MINES
West Red Lake Gold Mines Ltd. is a mineral exploration company that is publicly traded and focused on advancing and developing its flagship Madsen Gold Mine and the associated 47 km2 highly prospective land package in the Red Lake district of Ontario. The highly productive Red Lake Gold District of Northwest Ontario, Canada has yielded over 30 million ounces of gold from high-grade zones and hosts some of the world's richest gold deposits. WRLG also holds the wholly owned Rowan Property in Red Lake, with an expansive property position covering 31 km2 including three past producing gold mines - Rowan, Mount Jamie, and Red Summit.

ON BEHALF OF WEST RED LAKE GOLD MINES LTD.
“Shane Williams”
Shane Williams
President & Chief Executive Officer
FOR FURTHER INFORMATION, PLEASE CONTACT:
Freddie Leigh
Tel: (604) 609-6132
Email: investors@westredlakegold.com or visit the Company’s website at https://www.westredlakegold.com
Neither the TSX Venture Exchange nor its Regulation Services Provider (as that term is defined in the policies of the TSX Venture Exchange) accepts responsibility for the adequacy or accuracy of this release.
Certain statements contained in this news release constitute "forward-looking statements". When used in this document, the words "anticipated", "expect", "estimated", "forecast", "planned", and similar expressions are intended to identify forward-looking statements or information. These statements are based on current expectations of management, however, they are subject to known and unknown risks, uncertainties and other factors that may cause actual results to differ materially from the forward-looking statements in this news release and include without limitation, statements relating to the Rowan Property potential and the Company’s future objectives and plans. Readers are cautioned not to place undue reliance on these statements. West Red Lake Gold Mines Ltd. does not undertake any obligation to revise or update any forward- looking statements as a result of new information, future events or otherwise after the date hereof, except as required by securities laws.
Forward‐looking statements involve numerous risks and uncertainties and actual results might differ materially from results suggested in any forward-looking statements. These risks and uncertainties include, among other things, market volatility; the state of the financial markets for the Company’s securities; fluctuations in commodity prices and changes in the Company’s business plans. In making the forward-looking statements in this news release, the Company has applied several material assumptions that the Company believes are reasonable, including without limitation, that the Company will continue with its stated business objectives and its ability to raise additional capital to proceed. Although management of the Company has attempted to identify important factors that could cause actual results to differ materially from those contained in forward-looking statements or forward-looking information, there may be other factors that cause results not to be as anticipated, estimated or intended. There can be no assurance that such statements will prove to be accurate, as actual results and future events could differ materially from those anticipated in such statements. Accordingly, readers should not place undue reliance on forward-looking statements and forward-looking information. Readers are cautioned that reliance on such information may not be appropriate for other purposes. The Company does not undertake to update any forward-looking statement, forward-looking information or financial out-look that are incorporated by reference herein, except in accordance with applicable securities laws. The Company seeks safe harbor.
For more information on the Company, investors should review the Company’s continuous disclosure filings that are available at www.sedarplus.ca.
1 Mineral Resources are estimated at a cut-off grade of 3.8 g/t Au and using a gold price of US$1,600/oz. Please refer to the technical report entitled “Technical Report and Resource Estimate on the West Red Lake Project” dated December 13, 2022 prepared for WRLG by John Kita, P.Eng., and filed December 30, 2022 on www.sedarplus.ca.
Photos accompanying this announcement are available at
https://www.globenewswire.com/NewsRoom/AttachmentNg/e24b548a-759d-4910-a791-36adb31ab8af
https://www.globenewswire.com/NewsRoom/AttachmentNg/eb386c80-ab68-4bfe-816c-6d766d4952c9
https://www.globenewswire.com/NewsRoom/AttachmentNg/82b0dfe8-e3cc-4c7e-9a9c-0c9b82f6409d
https://www.globenewswire.com/NewsRoom/AttachmentNg/5aa1381c-61d7-4129-8cbf-605687b458d6
https://www.globenewswire.com/NewsRoom/AttachmentNg/307f47f3-7fa5-43e4-ada3-c6462fd773ba
https://www.globenewswire.com/NewsRoom/AttachmentNg/e0616c99-33d0-435e-b673-a052e60b31cd
https://www.globenewswire.com/NewsRoom/AttachmentNg/5c4d00cb-1d7c-4491-9c89-b4f5dd34f9af

