What's Driving Grid Dynamics Holdings Inc's Surprising 31% Stock Rally?
Grid Dynamics Holdings Inc (NASDAQ:GDYN) has been making waves in the stock market with a remarkable 14.52% gain over the past week and a 30.81% surge over the past three months. The company's current market cap stands at $1 billion, with its stock price at $13.32. According to the GF Value, a measure defined by GuruFocus.com that calculates a stock's intrinsic value using historical multiples, past performance adjustments, and future business estimates, the stock is significantly undervalued at a GF Value of $20.25. This is a slight decrease from the past GF Value of $20.84, but the stock remains significantly undervalued, indicating potential for further growth.
Company Overview: Grid Dynamics Holdings Inc
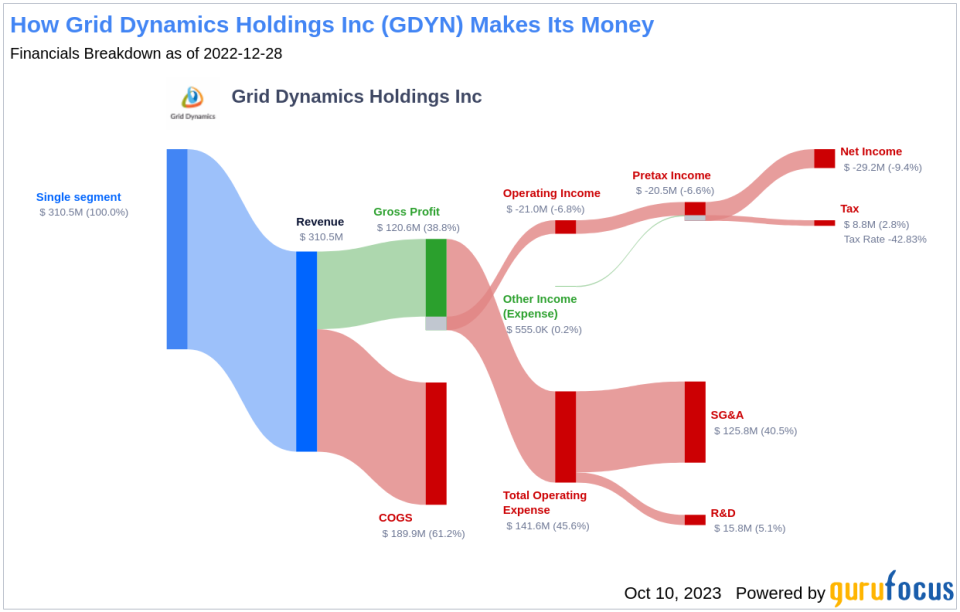
Grid Dynamics Holdings Inc operates in the software industry, providing enterprise-level digital transformation to Fortune 1000 companies. The company delivers tailored solutions in several industry verticals such as Tech, Media and Telecom, Retail, Finance, and Consumer Packaged goods (CPG)/manufacturing. With a global presence, the company generates revenue from North America, Europe, and other regions.
Profitability Analysis
Grid Dynamics Holdings Inc has a Profitability Rank of 5/10, indicating average profitability. The company's Operating Margin stands at -4.71%, which is better than 36.61% of the companies in the industry. The ROE and ROA are -5.59% and -4.84% respectively, better than 37.12% and 37.53% of the companies in the industry. The ROIC is -25.21%, better than 20.73% of the companies in the industry. Over the past 10 years, the company has had 3 years of profitability, which is better than 27.4% of the companies in the industry.
Growth Prospects
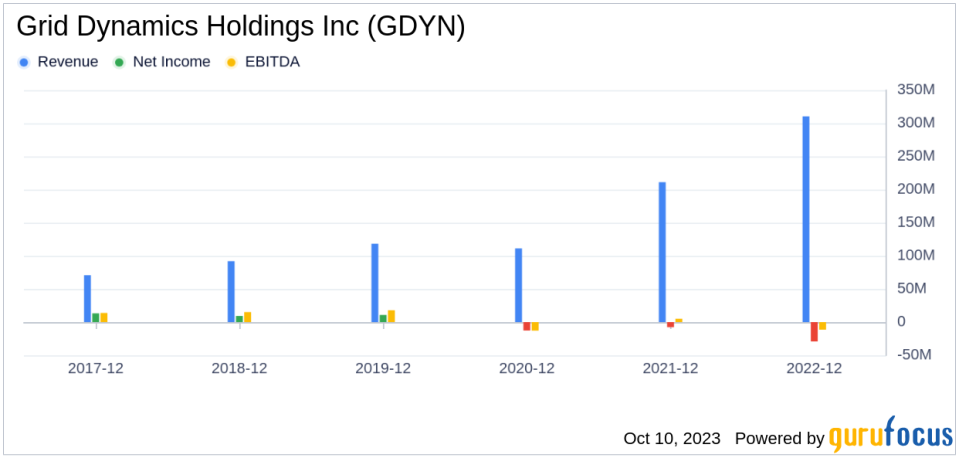
The company's Growth Rank is 7/10, indicating above-average growth. The 3-Year Revenue Growth Rate per Share is 24.40%, better than 79.72% of the companies in the industry. The 5-Year Revenue Growth Rate per Share is 25.70%, better than 88.33% of the companies in the industry. These figures suggest that Grid Dynamics Holdings Inc has strong growth potential.
Major Stock Holders
The top three holders of Grid Dynamics Holdings Inc's stock are Ron Baron (Trades, Portfolio), Jim Simons (Trades, Portfolio), and Steven Cohen (Trades, Portfolio). Ron Baron (Trades, Portfolio) holds the largest number of shares, with 3,000,000 shares, representing 3.98% of the company's stock. Jim Simons (Trades, Portfolio) holds 142,994 shares, representing 0.19% of the company's stock. Steven Cohen (Trades, Portfolio) holds 43 shares, representing a negligible percentage of the company's stock.
Competitive Landscape
Grid Dynamics Holdings Inc faces competition from several companies in the software industry. Computer Services Inc (CSVI) has a market cap of $1.59 billion, Conduent Inc (NASDAQ:CNDT) has a market cap of $751.214 million, and Global Blue Group Holding AG (NYSE:GB) has a market cap of $1.1 billion. These figures suggest that Grid Dynamics Holdings Inc is in a competitive position within the industry.
Conclusion
In conclusion, Grid Dynamics Holdings Inc's stock has shown impressive performance with a 30.81% gain over the past three months. The company's GF Value indicates that the stock is significantly undervalued, suggesting potential for further growth. The company's profitability and growth ranks, along with its competitive position within the industry, make it a promising investment. However, investors should conduct further research and consider their risk tolerance before investing.
This article, generated by GuruFocus, is designed to provide general insights and is not tailored financial advice. Our commentary is rooted in historical data and analyst projections, utilizing an impartial methodology, and is not intended to serve as specific investment guidance. It does not formulate a recommendation to purchase or divest any stock and does not consider individual investment objectives or financial circumstances. Our objective is to deliver long-term, fundamental data-driven analysis. Be aware that our analysis might not incorporate the most recent, price-sensitive company announcements or qualitative information. GuruFocus holds no position in the stocks mentioned herein.
This article first appeared on GuruFocus.
