Where American Express Company (NYSE:AXP) Stands In Terms Of Earnings Growth Against Its Industry

For long term investors, improvement in profitability and outperformance against the industry can be important characteristics in a stock. In this article, I will take a look at American Express Company’s (NYSE:AXP) track record on a high level, to give you some insight into how the company has been performing against its historical trend and its industry peers. See our latest analysis for American Express
Did AXP perform worse than its track record and industry?
For the most up-to-date info, I use data from the most recent 12 months, which annualizes the most recent half-year data, or in some cases, the latest annual report is already the most recent financial year data. This allows me to analyze various companies on a similar basis, using new information. For American Express, its most recent bottom-line (trailing twelve month) is US$2.63B, which, in comparison to the previous year’s figure, has plunged by a substantial -50.16%. Since these values are fairly short-term, I have determined an annualized five-year figure for AXP’s net income, which stands at US$4.99B This doesn’t look much better, as earnings seem to have steadily been diminishing over time.
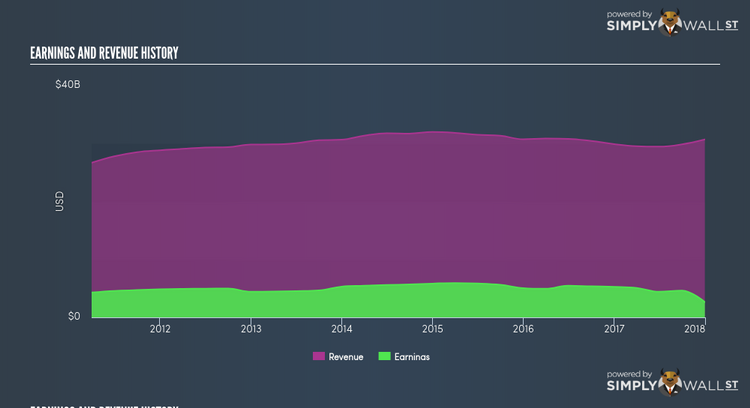
What could be happening here? Let’s examine what’s transpiring with margins and whether the rest of the industry is experiencing the hit as well. Revenue growth over the past few years, has been positive, however, earnings growth has not been able to catch up, meaning American Express has been increasing its expenses by a lot more. This harms margins and earnings, and is not a sustainable practice. Scanning growth from a sector-level, the US consumer finance industry has been growing, albeit, at a muted single-digit rate of 3.62% in the past twelve months, and 7.95% over the last five years. This means whatever near-term headwind the industry is enduring, it’s hitting American Express harder than its peers.
What does this mean?
American Express’s track record can be a valuable insight into its earnings performance, but it certainly doesn’t tell the whole story. Generally companies that experience a drawn out period of diminishing earnings are going through some sort of reinvestment phase . Though if the entire industry is struggling to grow over time, it may be a sign of a structural change, which makes American Express and its peers a higher risk investment. You should continue to research American Express to get a more holistic view of the stock by looking at:
1. Future Outlook: What are well-informed industry analysts predicting for AXP’s future growth? Take a look at our free research report of analyst consensus for AXP’s outlook.
2. Financial Health: Is AXP’s operations financially sustainable? Balance sheets can be hard to analyze, which is why we’ve done it for you. Check out our financial health checks here.
3. Other High-Performing Stocks: Are there other stocks that provide better prospects with proven track records? Explore our free list of these great stocks here.
NB: Figures in this article are calculated using data from the trailing twelve months from 31 December 2017. This may not be consistent with full year annual report figures.
To help readers see pass the short term volatility of the financial market, we aim to bring you a long-term focused research analysis purely driven by fundamental data. Note that our analysis does not factor in the latest price sensitive company announcements.
The author is an independent contributor and at the time of publication had no position in the stocks mentioned.
