Where Target Energy Limited (ASX:TEX) Stands In Earnings Growth Against Its Industry

After looking at Target Energy Limited’s (ASX:TEX) latest earnings update (30 June 2017), I found it helpful to revisit the company’s performance in the past couple of years and compare this against the latest numbers. As a long-term investor I tend to focus on earnings trend, rather than a single number at one point in time. Also, comparing it against an industry benchmark to understand whether it outperformed, or is simply riding an industry wave, is an important aspect. In this article I briefly touch on my key findings. View our latest analysis for Target Energy
How Well Did TEX Perform?
I like to use data from the most recent 12 months, which annualizes the most recent half-year data, or in some cases, the latest annual report is already the most recent financial year data. This technique allows me to examine different companies on a more comparable basis, using new information. For Target Energy, its most recent trailing-twelve-month earnings is -AU$2.25M, which, against the previous year’s figure, has become less negative. Since these figures are relatively nearsighted, I have created an annualized five-year figure for TEX’s earnings, which stands at -AU$7.31M. This suggests that, while net income is negative, it has become less negative over the years.
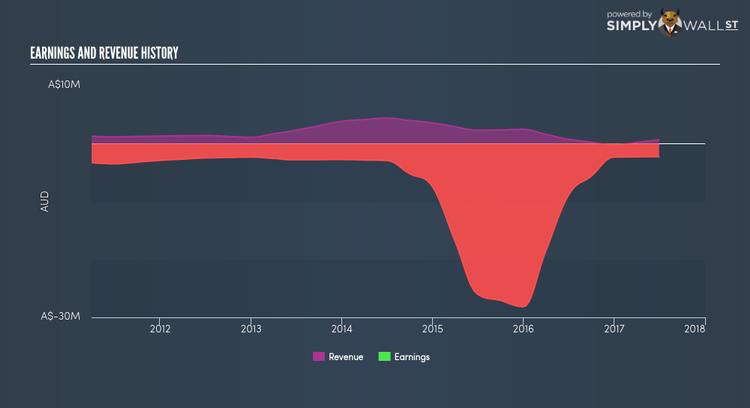
We can further evaluate Target Energy’s loss by looking at what the industry has been experiencing over the past few years. Each year, for the past half a decade Target Energy has seen an annual decline in revenue of -3.72%, on average. This adverse movement is a driver of the company’s inability to reach breakeven. Has the entire industry experienced this headwind? Scanning growth from a sector-level, the Australian oil and gas industry has been multiplying growth, more than doubling average earnings over the prior twelve months, and a double-digit 11.17% over the past five years. This means that whatever uplift the industry is profiting from, Target Energy has not been able to gain as much as its average peer.
What does this mean?
While past data is useful, it doesn’t tell the whole story. With companies that are currently loss-making, it is always hard to envisage what will occur going forward, and when. The most valuable step is to examine company-specific issues Target Energy may be facing and whether management guidance has regularly been met in the past. I recommend you continue to research Target Energy to get a more holistic view of the stock by looking at:
Financial Health: Is TEX’s operations financially sustainable? Balance sheets can be hard to analyze, which is why we’ve done it for you. Check out our financial health checks here.
Other High-Performing Stocks: Are there other stocks that provide better prospects with proven track records? Explore our free list of these great stocks here.
NB: Figures in this article are calculated using data from the trailing twelve months from 30 June 2017. This may not be consistent with full year annual report figures.
To help readers see pass the short term volatility of the financial market, we aim to bring you a long-term focused research analysis purely driven by fundamental data. Note that our analysis does not factor in the latest price sensitive company announcements.
The author is an independent contributor and at the time of publication had no position in the stocks mentioned.
