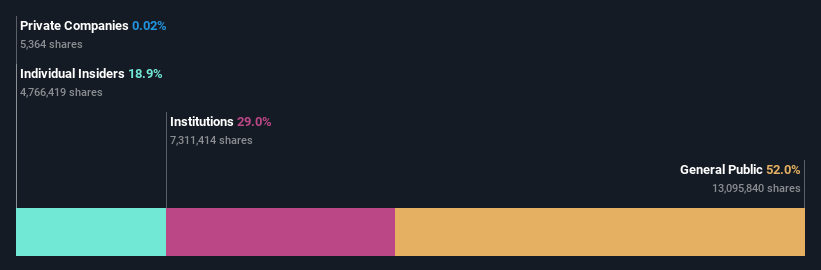
While institutions own 29% of Sprott Inc. (TSE:SII), retail investors are its largest shareholders with 52% ownership
Key Insights
Sprott's significant retail investors ownership suggests that the key decisions are influenced by shareholders from the larger public
42% of the business is held by the top 25 shareholders
Every investor in Sprott Inc. (TSE:SII) should be aware of the most powerful shareholder groups. We can see that retail investors own the lion's share in the company with 52% ownership. Put another way, the group faces the maximum upside potential (or downside risk).
Meanwhile, institutions make up 29% of the company’s shareholders. Insiders often own a large chunk of younger, smaller, companies while huge companies tend to have institutions as shareholders.
Let's delve deeper into each type of owner of Sprott, beginning with the chart below.
Check out our latest analysis for Sprott
What Does The Institutional Ownership Tell Us About Sprott?
Institutional investors commonly compare their own returns to the returns of a commonly followed index. So they generally do consider buying larger companies that are included in the relevant benchmark index.
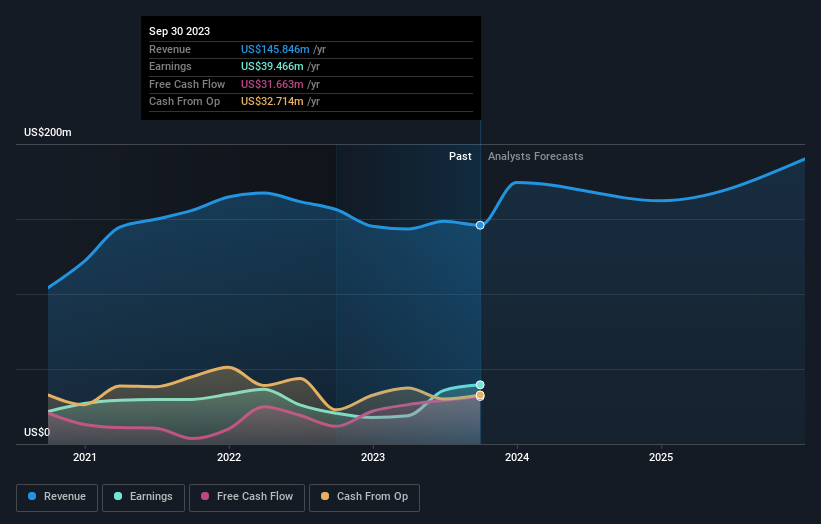
As you can see, institutional investors have a fair amount of stake in Sprott. This suggests some credibility amongst professional investors. But we can't rely on that fact alone since institutions make bad investments sometimes, just like everyone does. If multiple institutions change their view on a stock at the same time, you could see the share price drop fast. It's therefore worth looking at Sprott's earnings history below. Of course, the future is what really matters.
Sprott is not owned by hedge funds. The company's largest shareholder is Arthur Rule, with ownership of 11%. With 5.5% and 4.4% of the shares outstanding respectively, W. George and Waratah Capital Advisors Ltd. are the second and third largest shareholders. W. George, who is the second-largest shareholder, also happens to hold the title of Chief Executive Officer.
A deeper look at our ownership data shows that the top 25 shareholders collectively hold less than half of the register, suggesting a large group of small holders where no single shareholder has a majority.
While it makes sense to study institutional ownership data for a company, it also makes sense to study analyst sentiments to know which way the wind is blowing. There is some analyst coverage of the stock, but it could still become more well known, with time.
Insider Ownership Of Sprott
While the precise definition of an insider can be subjective, almost everyone considers board members to be insiders. Management ultimately answers to the board. However, it is not uncommon for managers to be executive board members, especially if they are a founder or the CEO.
I generally consider insider ownership to be a good thing. However, on some occasions it makes it more difficult for other shareholders to hold the board accountable for decisions.
It seems insiders own a significant proportion of Sprott Inc.. Insiders have a CA$201m stake in this CA$1.1b business. This may suggest that the founders still own a lot of shares. You can click here to see if they have been buying or selling.
General Public Ownership
The general public, mostly comprising of individual investors, collectively holds 52% of Sprott shares. This size of ownership gives investors from the general public some collective power. They can and probably do influence decisions on executive compensation, dividend policies and proposed business acquisitions.
Next Steps:
I find it very interesting to look at who exactly owns a company. But to truly gain insight, we need to consider other information, too. For instance, we've identified 1 warning sign for Sprott that you should be aware of.
Ultimately the future is most important. You can access this free report on analyst forecasts for the company.
NB: Figures in this article are calculated using data from the last twelve months, which refer to the 12-month period ending on the last date of the month the financial statement is dated. This may not be consistent with full year annual report figures.
Have feedback on this article? Concerned about the content? Get in touch with us directly. Alternatively, email editorial-team (at) simplywallst.com.
This article by Simply Wall St is general in nature. We provide commentary based on historical data and analyst forecasts only using an unbiased methodology and our articles are not intended to be financial advice. It does not constitute a recommendation to buy or sell any stock, and does not take account of your objectives, or your financial situation. We aim to bring you long-term focused analysis driven by fundamental data. Note that our analysis may not factor in the latest price-sensitive company announcements or qualitative material. Simply Wall St has no position in any stocks mentioned.
