While shareholders of Nu Skin Enterprises (NYSE:NUS) are in the red over the last three years, underlying earnings have actually grown
Nu Skin Enterprises, Inc. (NYSE:NUS) shareholders should be happy to see the share price up 25% in the last quarter. But that cannot eclipse the less-than-impressive returns over the last three years. Truth be told the share price declined 17% in three years and that return, Dear Reader, falls short of what you could have got from passive investing with an index fund.
While the last three years has been tough for Nu Skin Enterprises shareholders, this past week has shown signs of promise. So let's look at the longer term fundamentals and see if they've been the driver of the negative returns.
Check out our latest analysis for Nu Skin Enterprises
While markets are a powerful pricing mechanism, share prices reflect investor sentiment, not just underlying business performance. One flawed but reasonable way to assess how sentiment around a company has changed is to compare the earnings per share (EPS) with the share price.
During the unfortunate three years of share price decline, Nu Skin Enterprises actually saw its earnings per share (EPS) improve by 17% per year. This is quite a puzzle, and suggests there might be something temporarily buoying the share price. Or else the company was over-hyped in the past, and so its growth has disappointed.
Since the change in EPS doesn't seem to correlate with the change in share price, it's worth taking a look at other metrics.
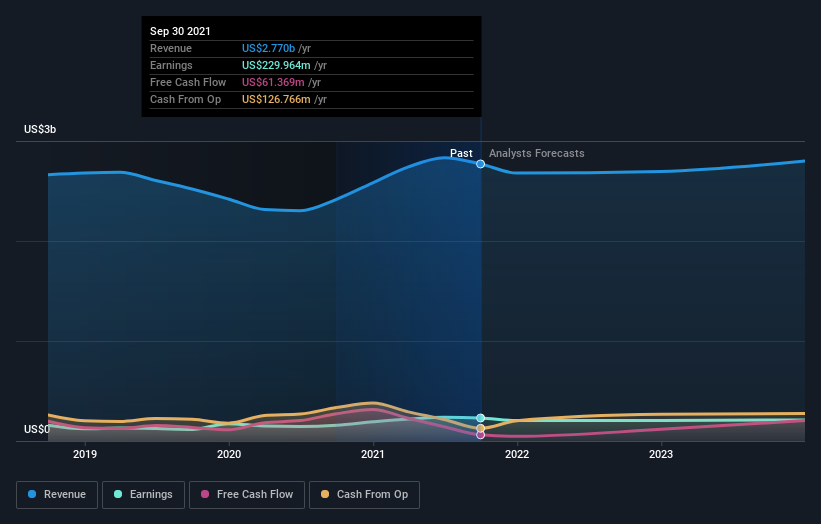
With revenue flat over three years, it seems unlikely that the share price is reflecting the top line. We're not entirely sure why the share price is dropped, but it does seem likely investors have become less optimistic about the business.
The company's revenue and earnings (over time) are depicted in the image below (click to see the exact numbers).
We consider it positive that insiders have made significant purchases in the last year. Having said that, most people consider earnings and revenue growth trends to be a more meaningful guide to the business. So it makes a lot of sense to check out what analysts think Nu Skin Enterprises will earn in the future (free profit forecasts).
What About Dividends?
When looking at investment returns, it is important to consider the difference between total shareholder return (TSR) and share price return. The TSR is a return calculation that accounts for the value of cash dividends (assuming that any dividend received was reinvested) and the calculated value of any discounted capital raisings and spin-offs. So for companies that pay a generous dividend, the TSR is often a lot higher than the share price return. As it happens, Nu Skin Enterprises' TSR for the last 3 years was -7.9%, which exceeds the share price return mentioned earlier. The dividends paid by the company have thusly boosted the total shareholder return.
A Different Perspective
Investors in Nu Skin Enterprises had a tough year, with a total loss of 1.8% (including dividends), against a market gain of about 22%. Even the share prices of good stocks drop sometimes, but we want to see improvements in the fundamental metrics of a business, before getting too interested. On the bright side, long term shareholders have made money, with a gain of 4% per year over half a decade. It could be that the recent sell-off is an opportunity, so it may be worth checking the fundamental data for signs of a long term growth trend. It's always interesting to track share price performance over the longer term. But to understand Nu Skin Enterprises better, we need to consider many other factors. Case in point: We've spotted 1 warning sign for Nu Skin Enterprises you should be aware of.
If you like to buy stocks alongside management, then you might just love this free list of companies. (Hint: insiders have been buying them).
Please note, the market returns quoted in this article reflect the market weighted average returns of stocks that currently trade on US exchanges.
Have feedback on this article? Concerned about the content? Get in touch with us directly. Alternatively, email editorial-team (at) simplywallst.com.
This article by Simply Wall St is general in nature. We provide commentary based on historical data and analyst forecasts only using an unbiased methodology and our articles are not intended to be financial advice. It does not constitute a recommendation to buy or sell any stock, and does not take account of your objectives, or your financial situation. We aim to bring you long-term focused analysis driven by fundamental data. Note that our analysis may not factor in the latest price-sensitive company announcements or qualitative material. Simply Wall St has no position in any stocks mentioned.
