Whitbread plc's (LON:WTB) Stock Has Shown Weakness Lately But Financial Prospects Look Decent: Is The Market Wrong?
It is hard to get excited after looking at Whitbread's (LON:WTB) recent performance, when its stock has declined 6.2% over the past three months. However, the company's fundamentals look pretty decent, and long-term financials are usually aligned with future market price movements. In this article, we decided to focus on Whitbread's ROE.
ROE or return on equity is a useful tool to assess how effectively a company can generate returns on the investment it received from its shareholders. In simpler terms, it measures the profitability of a company in relation to shareholder's equity.
Check out our latest analysis for Whitbread
How To Calculate Return On Equity?
The formula for ROE is:
Return on Equity = Net Profit (from continuing operations) ÷ Shareholders' Equity
So, based on the above formula, the ROE for Whitbread is:
8.6% = UK£338m ÷ UK£3.9b (Based on the trailing twelve months to August 2023).
The 'return' is the profit over the last twelve months. So, this means that for every £1 of its shareholder's investments, the company generates a profit of £0.09.
Why Is ROE Important For Earnings Growth?
So far, we've learned that ROE is a measure of a company's profitability. Based on how much of its profits the company chooses to reinvest or "retain", we are then able to evaluate a company's future ability to generate profits. Assuming everything else remains unchanged, the higher the ROE and profit retention, the higher the growth rate of a company compared to companies that don't necessarily bear these characteristics.
Whitbread's Earnings Growth And 8.6% ROE
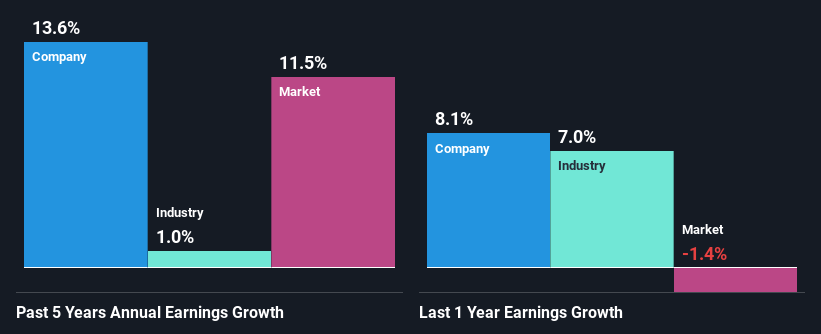
On the face of it, Whitbread's ROE is not much to talk about. However, given that the company's ROE is similar to the average industry ROE of 8.3%, we may spare it some thought. On the other hand, Whitbread reported a moderate 14% net income growth over the past five years. Considering the moderately low ROE, it is quite possible that there might be some other aspects that are positively influencing the company's earnings growth. For example, it is possible that the company's management has made some good strategic decisions, or that the company has a low payout ratio.
We then compared Whitbread's net income growth with the industry and we're pleased to see that the company's growth figure is higher when compared with the industry which has a growth rate of 1.0% in the same 5-year period.
The basis for attaching value to a company is, to a great extent, tied to its earnings growth. The investor should try to establish if the expected growth or decline in earnings, whichever the case may be, is priced in. Doing so will help them establish if the stock's future looks promising or ominous. Is Whitbread fairly valued compared to other companies? These 3 valuation measures might help you decide.
Is Whitbread Using Its Retained Earnings Effectively?
While Whitbread has a three-year median payout ratio of 51% (which means it retains 49% of profits), the company has still seen a fair bit of earnings growth in the past, meaning that its high payout ratio hasn't hampered its ability to grow.
Moreover, Whitbread is determined to keep sharing its profits with shareholders which we infer from its long history of paying a dividend for at least ten years. Based on the latest analysts' estimates, we found that the company's future payout ratio over the next three years is expected to hold steady at 44%. Still, forecasts suggest that Whitbread's future ROE will rise to 11% even though the the company's payout ratio is not expected to change by much.
Summary
On the whole, we do feel that Whitbread has some positive attributes. That is, quite an impressive growth in earnings. However, the low profit retention means that the company's earnings growth could have been higher, had it been reinvesting a higher portion of its profits. Having said that, the company's earnings growth is expected to slow down, as forecasted in the current analyst estimates. To know more about the latest analysts predictions for the company, check out this visualization of analyst forecasts for the company.
Have feedback on this article? Concerned about the content? Get in touch with us directly. Alternatively, email editorial-team (at) simplywallst.com.
This article by Simply Wall St is general in nature. We provide commentary based on historical data and analyst forecasts only using an unbiased methodology and our articles are not intended to be financial advice. It does not constitute a recommendation to buy or sell any stock, and does not take account of your objectives, or your financial situation. We aim to bring you long-term focused analysis driven by fundamental data. Note that our analysis may not factor in the latest price-sensitive company announcements or qualitative material. Simply Wall St has no position in any stocks mentioned.
