Why ATN International, Inc.’s (NASDAQ:ATNI) High P/E Ratio Isn’t Necessarily A Bad Thing

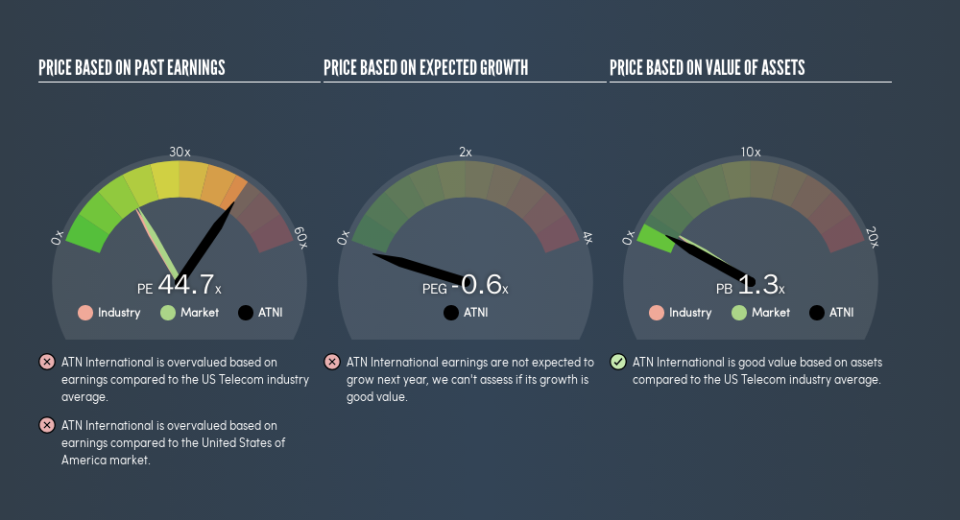
This article is written for those who want to get better at using price to earnings ratios (P/E ratios). To keep it practical, we’ll show how ATN International, Inc.’s (NASDAQ:ATNI) P/E ratio could help you assess the value on offer. ATN International has a price to earnings ratio of 44.69, based on the last twelve months. That means that at current prices, buyers pay $44.69 for every $1 in trailing yearly profits.
View our latest analysis for ATN International
How Do You Calculate A P/E Ratio?
The formula for price to earnings is:
Price to Earnings Ratio = Share Price ÷ Earnings per Share (EPS)
Or for ATN International:
P/E of 44.69 = $55.39 ÷ $1.24 (Based on the trailing twelve months to December 2018.)
Is A High Price-to-Earnings Ratio Good?
A higher P/E ratio means that investors are paying a higher price for each $1 of company earnings. That isn’t necessarily good or bad, but a high P/E implies relatively high expectations of what a company can achieve in the future.
How Growth Rates Impact P/E Ratios
Earnings growth rates have a big influence on P/E ratios. When earnings grow, the ‘E’ increases, over time. That means unless the share price increases, the P/E will reduce in a few years. A lower P/E should indicate the stock is cheap relative to others — and that may attract buyers.
ATN International saw earnings per share decrease by 36% last year. But EPS is up 28% over the last 3 years. And it has shrunk its earnings per share by 12% per year over the last five years. This could justify a pessimistic P/E.
How Does ATN International’s P/E Ratio Compare To Its Peers?
The P/E ratio indicates whether the market has higher or lower expectations of a company. As you can see below, ATN International has a higher P/E than the average company (16.8) in the telecom industry.
ATN International’s P/E tells us that market participants think the company will perform better than its industry peers, going forward. The market is optimistic about the future, but that doesn’t guarantee future growth. So investors should delve deeper. I like to check if company insiders have been buying or selling.
A Limitation: P/E Ratios Ignore Debt and Cash In The Bank
It’s important to note that the P/E ratio considers the market capitalization, not the enterprise value. In other words, it does not consider any debt or cash that the company may have on the balance sheet. Hypothetically, a company could reduce its future P/E ratio by spending its cash (or taking on debt) to achieve higher earnings.
Such spending might be good or bad, overall, but the key point here is that you need to look at debt to understand the P/E ratio in context.
How Does ATN International’s Debt Impact Its P/E Ratio?
The extra options and safety that comes with ATN International’s US$101m net cash position means that it deserves a higher P/E than it would if it had a lot of net debt.
The Bottom Line On ATN International’s P/E Ratio
ATN International trades on a P/E ratio of 44.7, which is above the US market average of 17.6. The recent drop in earnings per share might keep value investors away, but the net cash position means the company has time to improve: and the high P/E suggests the market thinks it will.
When the market is wrong about a stock, it gives savvy investors an opportunity. People often underestimate remarkable growth — so investors can make money when fast growth is not fully appreciated. So this free visual report on analyst forecasts could hold the key to an excellent investment decision.
Of course, you might find a fantastic investment by looking at a few good candidates. So take a peek at this free list of companies with modest (or no) debt, trading on a P/E below 20.
We aim to bring you long-term focused research analysis driven by fundamental data. Note that our analysis may not factor in the latest price-sensitive company announcements or qualitative material.
If you spot an error that warrants correction, please contact the editor at editorial-team@simplywallst.com. This article by Simply Wall St is general in nature. It does not constitute a recommendation to buy or sell any stock, and does not take account of your objectives, or your financial situation. Simply Wall St has no position in the stocks mentioned. Thank you for reading.
