Why You Should Care About Agile Content, S.A.’s (BME:AGIL) Low Return On Capital

Today we'll look at Agile Content, S.A. (BME:AGIL) and reflect on its potential as an investment. Specifically, we're going to calculate its Return On Capital Employed (ROCE), in the hopes of getting some insight into the business.
First of all, we'll work out how to calculate ROCE. Second, we'll look at its ROCE compared to similar companies. Last but not least, we'll look at what impact its current liabilities have on its ROCE.
What is Return On Capital Employed (ROCE)?
ROCE measures the 'return' (pre-tax profit) a company generates from capital employed in its business. Generally speaking a higher ROCE is better. Overall, it is a valuable metric that has its flaws. Renowned investment researcher Michael Mauboussin has suggested that a high ROCE can indicate that 'one dollar invested in the company generates value of more than one dollar'.
So, How Do We Calculate ROCE?
Analysts use this formula to calculate return on capital employed:
Return on Capital Employed = Earnings Before Interest and Tax (EBIT) ÷ (Total Assets - Current Liabilities)
Or for Agile Content:
0.018 = €303k ÷ (€25m - €8.6m) (Based on the trailing twelve months to December 2019.)
Therefore, Agile Content has an ROCE of 1.8%.
View our latest analysis for Agile Content
Is Agile Content's ROCE Good?
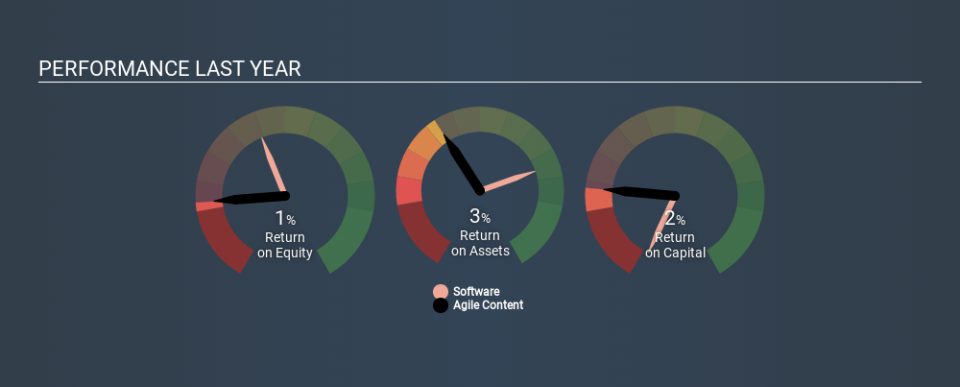
One way to assess ROCE is to compare similar companies. In this analysis, Agile Content's ROCE appears meaningfully below the 11% average reported by the Software industry. This could be seen as a negative, as it suggests some competitors may be employing their capital more efficiently. Putting aside Agile Content's performance relative to its industry, its ROCE in absolute terms is poor - considering the risk of owning stocks compared to government bonds. Readers may wish to look for more rewarding investments.
Agile Content reported an ROCE of 1.8% -- better than 3 years ago, when the company didn't make a profit. That implies the business has been improving. You can click on the image below to see (in greater detail) how Agile Content's past growth compares to other companies.
When considering this metric, keep in mind that it is backwards looking, and not necessarily predictive. Companies in cyclical industries can be difficult to understand using ROCE, as returns typically look high during boom times, and low during busts. This is because ROCE only looks at one year, instead of considering returns across a whole cycle. What happens in the future is pretty important for investors, so we have prepared a free report on analyst forecasts for Agile Content.
Agile Content's Current Liabilities And Their Impact On Its ROCE
Current liabilities are short term bills and invoices that need to be paid in 12 months or less. Due to the way the ROCE equation works, having large bills due in the near term can make it look as though a company has less capital employed, and thus a higher ROCE than usual. To counteract this, we check if a company has high current liabilities, relative to its total assets.
Agile Content has total assets of €25m and current liabilities of €8.6m. As a result, its current liabilities are equal to approximately 34% of its total assets. With a medium level of current liabilities boosting the ROCE a little, Agile Content's low ROCE is unappealing.
What We Can Learn From Agile Content's ROCE
So researching other companies may be a better use of your time. Of course, you might find a fantastic investment by looking at a few good candidates. So take a peek at this free list of companies with modest (or no) debt, trading on a P/E below 20.
I will like Agile Content better if I see some big insider buys. While we wait, check out this free list of growing companies with considerable, recent, insider buying.
If you spot an error that warrants correction, please contact the editor at editorial-team@simplywallst.com. This article by Simply Wall St is general in nature. It does not constitute a recommendation to buy or sell any stock, and does not take account of your objectives, or your financial situation. Simply Wall St has no position in the stocks mentioned.
We aim to bring you long-term focused research analysis driven by fundamental data. Note that our analysis may not factor in the latest price-sensitive company announcements or qualitative material. Thank you for reading.
