Why Colfax Corporation’s (NYSE:CFX) Return On Capital Employed Looks Uninspiring

Want to participate in a short research study? Help shape the future of investing tools and receive a $20 prize!
Today we are going to look at Colfax Corporation (NYSE:CFX) to see whether it might be an attractive investment prospect. To be precise, we’ll consider its Return On Capital Employed (ROCE), as that will inform our view of the quality of the business.
First, we’ll go over how we calculate ROCE. Second, we’ll look at its ROCE compared to similar companies. Finally, we’ll look at how its current liabilities affect its ROCE.
Understanding Return On Capital Employed (ROCE)
ROCE measures the amount of pre-tax profits a company can generate from the capital employed in its business. All else being equal, a better business will have a higher ROCE. Overall, it is a valuable metric that has its flaws. Author Edwin Whiting says to be careful when comparing the ROCE of different businesses, since ‘No two businesses are exactly alike.’
So, How Do We Calculate ROCE?
The formula for calculating the return on capital employed is:
Return on Capital Employed = Earnings Before Interest and Tax (EBIT) ÷ (Total Assets – Current Liabilities)
Or for Colfax:
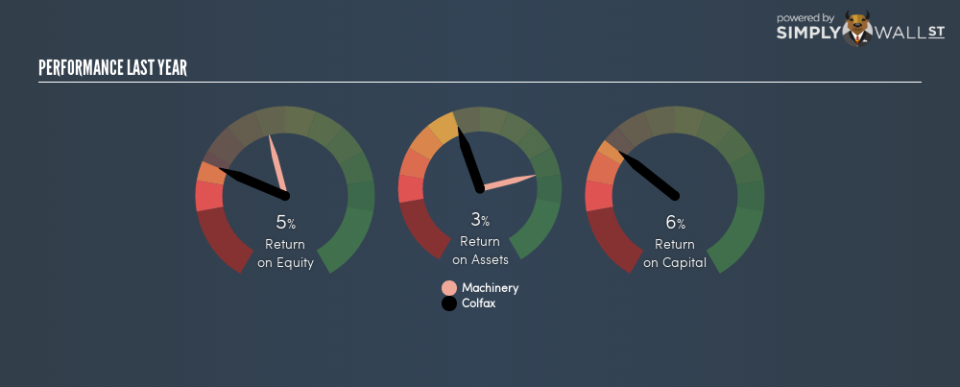
0.058 = US$315m ÷ (US$6.6b – US$1.2b) (Based on the trailing twelve months to December 2018.)
Therefore, Colfax has an ROCE of 5.8%.
View our latest analysis for Colfax
Does Colfax Have A Good ROCE?
One way to assess ROCE is to compare similar companies. In this analysis, Colfax’s ROCE appears meaningfully below the 12% average reported by the Machinery industry. This performance is not ideal, as it suggests the company may not be deploying its capital as effectively as some competitors. Setting aside the industry comparison for now, Colfax’s ROCE is mediocre in absolute terms, considering the risk of investing in stocks versus the safety of a bank account. It is possible that there are more rewarding investments out there.
Remember that this metric is backwards looking – it shows what has happened in the past, and does not accurately predict the future. ROCE can be deceptive for cyclical businesses, as returns can look incredible in boom times, and terribly low in downturns. This is because ROCE only looks at one year, instead of considering returns across a whole cycle. Since the future is so important for investors, you should check out our free report on analyst forecasts for Colfax.
Do Colfax’s Current Liabilities Skew Its ROCE?
Liabilities, such as supplier bills and bank overdrafts, are referred to as current liabilities if they need to be paid within 12 months. Due to the way the ROCE equation works, having large bills due in the near term can make it look as though a company has less capital employed, and thus a higher ROCE than usual. To check the impact of this, we calculate if a company has high current liabilities relative to its total assets.
Colfax has total assets of US$6.6b and current liabilities of US$1.2b. As a result, its current liabilities are equal to approximately 18% of its total assets. It is good to see a restrained amount of current liabilities, as this limits the effect on ROCE.
The Bottom Line On Colfax’s ROCE
If Colfax continues to earn an uninspiring ROCE, there may be better places to invest. You might be able to find a better buy than Colfax. If you want a selection of possible winners, check out this free list of interesting companies that trade on a P/E below 20 (but have proven they can grow earnings).
I will like Colfax better if I see some big insider buys. While we wait, check out this free list of growing companies with considerable, recent, insider buying.
We aim to bring you long-term focused research analysis driven by fundamental data. Note that our analysis may not factor in the latest price-sensitive company announcements or qualitative material.
If you spot an error that warrants correction, please contact the editor at editorial-team@simplywallst.com. This article by Simply Wall St is general in nature. It does not constitute a recommendation to buy or sell any stock, and does not take account of your objectives, or your financial situation. Simply Wall St has no position in the stocks mentioned. On rare occasion, data errors may occur. Thank you for reading.
