Why We Like Evolution Gaming Group AB (publ)’s (STO:EVO) 58% Return On Capital Employed

Today we'll look at Evolution Gaming Group AB (publ) (STO:EVO) and reflect on its potential as an investment. Specifically, we'll consider its Return On Capital Employed (ROCE), since that will give us an insight into how efficiently the business can generate profits from the capital it requires.
Firstly, we'll go over how we calculate ROCE. Then we'll compare its ROCE to similar companies. Finally, we'll look at how its current liabilities affect its ROCE.
What is Return On Capital Employed (ROCE)?
ROCE is a measure of a company's yearly pre-tax profit (its return), relative to the capital employed in the business. All else being equal, a better business will have a higher ROCE. In brief, it is a useful tool, but it is not without drawbacks. Renowned investment researcher Michael Mauboussin has suggested that a high ROCE can indicate that 'one dollar invested in the company generates value of more than one dollar'.
How Do You Calculate Return On Capital Employed?
Analysts use this formula to calculate return on capital employed:
Return on Capital Employed = Earnings Before Interest and Tax (EBIT) ÷ (Total Assets - Current Liabilities)
Or for Evolution Gaming Group:
0.58 = €117m ÷ (€296m - €95m) (Based on the trailing twelve months to June 2019.)
So, Evolution Gaming Group has an ROCE of 58%.
See our latest analysis for Evolution Gaming Group
Does Evolution Gaming Group Have A Good ROCE?
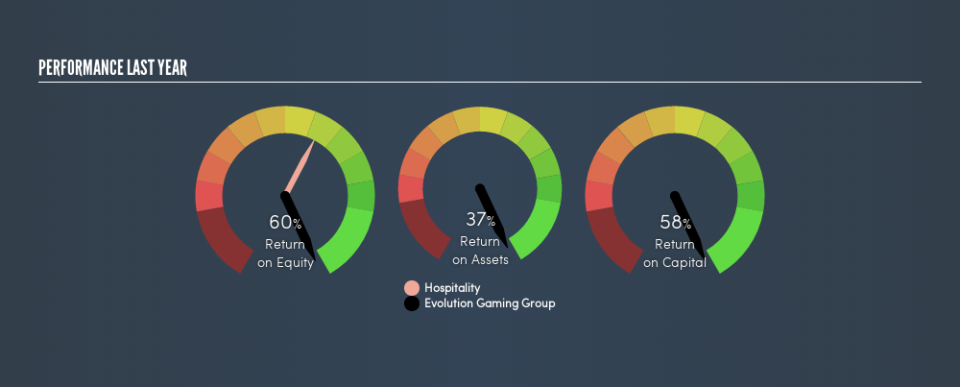
When making comparisons between similar businesses, investors may find ROCE useful. Evolution Gaming Group's ROCE appears to be substantially greater than the 18% average in the Hospitality industry. We consider this a positive sign, because it suggests it uses capital more efficiently than similar companies. Setting aside the comparison to its industry for a moment, Evolution Gaming Group's ROCE in absolute terms currently looks quite high.
The image below shows how Evolution Gaming Group's ROCE compares to its industry, and you can click it to see more detail on its past growth.
Remember that this metric is backwards looking - it shows what has happened in the past, and does not accurately predict the future. ROCE can be deceptive for cyclical businesses, as returns can look incredible in boom times, and terribly low in downturns. ROCE is only a point-in-time measure. Future performance is what matters, and you can see analyst predictions in our free report on analyst forecasts for the company.
Do Evolution Gaming Group's Current Liabilities Skew Its ROCE?
Current liabilities are short term bills and invoices that need to be paid in 12 months or less. The ROCE equation subtracts current liabilities from capital employed, so a company with a lot of current liabilities appears to have less capital employed, and a higher ROCE than otherwise. To counteract this, we check if a company has high current liabilities, relative to its total assets.
Evolution Gaming Group has total liabilities of €95m and total assets of €296m. As a result, its current liabilities are equal to approximately 32% of its total assets. Evolution Gaming Group's ROCE is boosted somewhat by its middling amount of current liabilities.
The Bottom Line On Evolution Gaming Group's ROCE
Still, it has a high ROCE, and may be an interesting prospect for further research. Evolution Gaming Group looks strong on this analysis, but there are plenty of other companies that could be a good opportunity . Here is a free list of companies growing earnings rapidly.
For those who like to find winning investments this free list of growing companies with recent insider purchasing, could be just the ticket.
We aim to bring you long-term focused research analysis driven by fundamental data. Note that our analysis may not factor in the latest price-sensitive company announcements or qualitative material.
If you spot an error that warrants correction, please contact the editor at editorial-team@simplywallst.com. This article by Simply Wall St is general in nature. It does not constitute a recommendation to buy or sell any stock, and does not take account of your objectives, or your financial situation. Simply Wall St has no position in the stocks mentioned. Thank you for reading.
