Why Gilat Satellite Networks Ltd (NASDAQ:GILT) May Not Be As Efficient As Its Industry

I am writing today to help inform people who are new to the stock market and want to learn about Return on Equity using a real-life example.
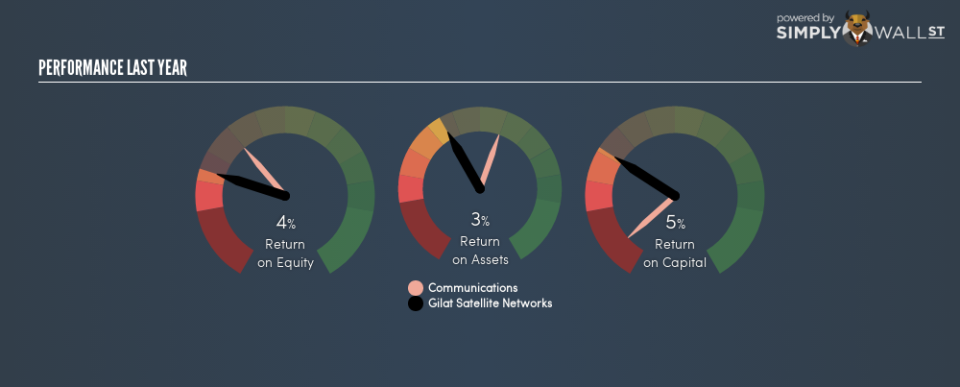
Gilat Satellite Networks Ltd (NASDAQ:GILT) delivered a less impressive 4.4% ROE over the past year, compared to the 9.5% return generated by its industry. Though GILT’s recent performance is underwhelming, it is useful to understand what ROE is made up of and how it should be interpreted. Knowing these components can change your views on GILT’s below-average returns. Today I will look at how components such as financial leverage can influence ROE which may impact the sustainability of GILT’s returns.
Check out our latest analysis for Gilat Satellite Networks
Peeling the layers of ROE – trisecting a company’s profitability
Firstly, Return on Equity, or ROE, is simply the percentage of last years’ earning against the book value of shareholders’ equity. An ROE of 4.4% implies $0.044 returned on every $1 invested. Generally speaking, a higher ROE is preferred; however, there are other factors we must also consider before making any conclusions.
Return on Equity = Net Profit ÷ Shareholders Equity
ROE is measured against cost of equity in order to determine the efficiency of Gilat Satellite Networks’s equity capital deployed. Its cost of equity is 10.0%. Since Gilat Satellite Networks’s return does not cover its cost, with a difference of -5.5%, this means its current use of equity is not efficient and not sustainable. Very simply, Gilat Satellite Networks pays more for its capital than what it generates in return. ROE can be dissected into three distinct ratios: net profit margin, asset turnover, and financial leverage. This is called the Dupont Formula:
Dupont Formula
ROE = profit margin × asset turnover × financial leverage
ROE = (annual net profit ÷ sales) × (sales ÷ assets) × (assets ÷ shareholders’ equity)
ROE = annual net profit ÷ shareholders’ equity
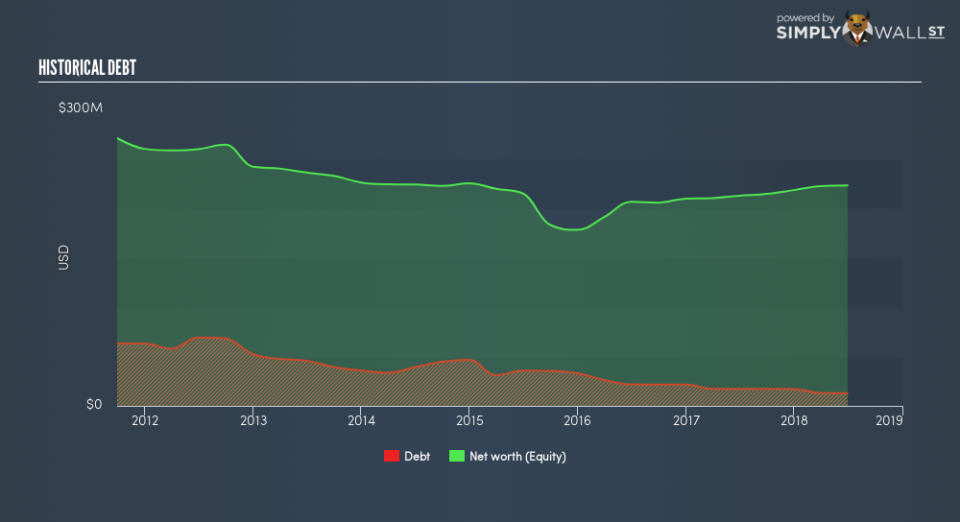
Basically, profit margin measures how much of revenue trickles down into earnings which illustrates how efficient the business is with its cost management. Asset turnover shows how much revenue Gilat Satellite Networks can generate with its current asset base. The most interesting ratio, and reflective of sustainability of its ROE, is financial leverage. Since ROE can be inflated by excessive debt, we need to examine Gilat Satellite Networks’s debt-to-equity level. Currently the debt-to-equity ratio stands at a low 5.7%, which means Gilat Satellite Networks still has headroom to take on more leverage in order to increase profits.
Next Steps:
ROE is one of many ratios which meaningfully dissects financial statements, which illustrates the quality of a company. Gilat Satellite Networks exhibits a weak ROE against its peers, as well as insufficient levels to cover its own cost of equity this year. However, ROE is not likely to be inflated by excessive debt funding, giving shareholders more conviction in the sustainability of returns, which has headroom to increase further. ROE is a helpful signal, but it is definitely not sufficient on its own to make an investment decision.
For Gilat Satellite Networks, there are three pertinent aspects you should further research:
Financial Health: Does it have a healthy balance sheet? Take a look at our free balance sheet analysis with six simple checks on key factors like leverage and risk.
Future Earnings: How does Gilat Satellite Networks’s growth rate compare to its peers and the wider market? Dig deeper into the analyst consensus number for the upcoming years by interacting with our free analyst growth expectation chart.
Other High-Growth Alternatives : Are there other high-growth stocks you could be holding instead of Gilat Satellite Networks? Explore our interactive list of stocks with large growth potential to get an idea of what else is out there you may be missing!
To help readers see past the short term volatility of the financial market, we aim to bring you a long-term focused research analysis purely driven by fundamental data. Note that our analysis does not factor in the latest price-sensitive company announcements.
The author is an independent contributor and at the time of publication had no position in the stocks mentioned. For errors that warrant correction please contact the editor at editorial-team@simplywallst.com.
