Why Huaneng Power International, Inc.'s (HKG:902) High P/E Ratio Isn't Necessarily A Bad Thing

Today, we'll introduce the concept of the P/E ratio for those who are learning about investing. To keep it practical, we'll show how Huaneng Power International, Inc.'s (HKG:902) P/E ratio could help you assess the value on offer. What is Huaneng Power International's P/E ratio? Well, based on the last twelve months it is 19.83. That is equivalent to an earnings yield of about 5.0%.
See our latest analysis for Huaneng Power International
How Do You Calculate Huaneng Power International's P/E Ratio?
The formula for P/E is:
Price to Earnings Ratio = Price per Share (in the reporting currency) ÷ Earnings per Share (EPS)
Or for Huaneng Power International:
P/E of 19.83 = HK$3.37 (Note: this is the share price in the reporting currency, namely, CNY ) ÷ HK$0.17 (Based on the year to June 2019.)
Is A High P/E Ratio Good?
The higher the P/E ratio, the higher the price tag of a business, relative to its trailing earnings. That is not a good or a bad thing per se, but a high P/E does imply buyers are optimistic about the future.
Does Huaneng Power International Have A Relatively High Or Low P/E For Its Industry?
The P/E ratio indicates whether the market has higher or lower expectations of a company. The image below shows that Huaneng Power International has a higher P/E than the average (9.1) P/E for companies in the renewable energy industry.
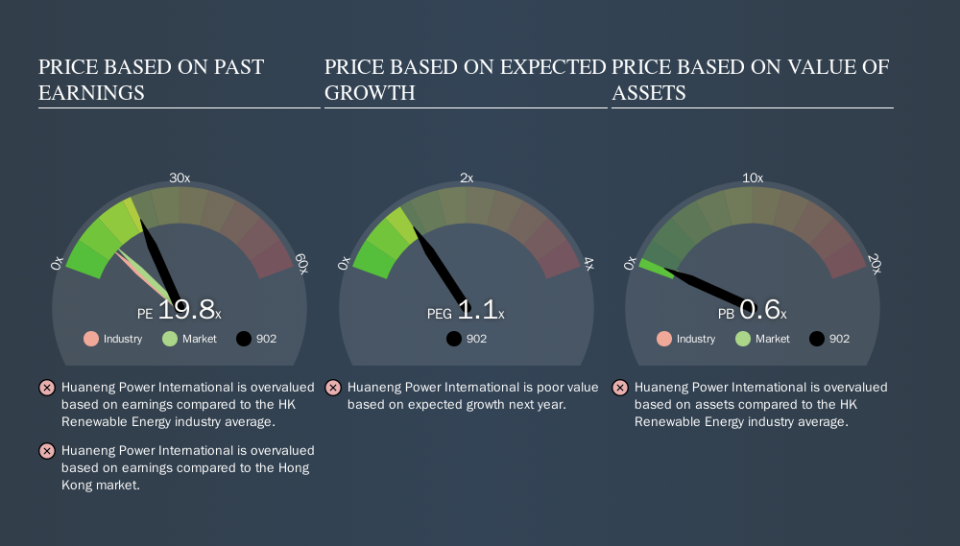
Huaneng Power International's P/E tells us that market participants think the company will perform better than its industry peers, going forward. Clearly the market expects growth, but it isn't guaranteed. So investors should delve deeper. I like to check if company insiders have been buying or selling.
How Growth Rates Impact P/E Ratios
If earnings fall then in the future the 'E' will be lower. That means unless the share price falls, the P/E will increase in a few years. A higher P/E should indicate the stock is expensive relative to others -- and that may encourage shareholders to sell.
Huaneng Power International's earnings per share fell by 11% in the last twelve months. And over the longer term (5 years) earnings per share have decreased 28% annually. This growth rate might warrant a below average P/E ratio.
Remember: P/E Ratios Don't Consider The Balance Sheet
It's important to note that the P/E ratio considers the market capitalization, not the enterprise value. Thus, the metric does not reflect cash or debt held by the company. In theory, a company can lower its future P/E ratio by using cash or debt to invest in growth.
Such spending might be good or bad, overall, but the key point here is that you need to look at debt to understand the P/E ratio in context.
Is Debt Impacting Huaneng Power International's P/E?
Huaneng Power International has net debt worth a very significant 297% of its market capitalization. If you want to compare its P/E ratio to other companies, you must keep in mind that these debt levels would usually warrant a relatively low P/E.
The Verdict On Huaneng Power International's P/E Ratio
Huaneng Power International has a P/E of 19.8. That's higher than the average in its market, which is 10.3. With significant debt and no EPS growth last year, shareholders are betting on an improvement in earnings from the company.
Investors have an opportunity when market expectations about a stock are wrong. People often underestimate remarkable growth -- so investors can make money when fast growth is not fully appreciated. So this free visual report on analyst forecasts could hold the key to an excellent investment decision.
Of course, you might find a fantastic investment by looking at a few good candidates. So take a peek at this free list of companies with modest (or no) debt, trading on a P/E below 20.
We aim to bring you long-term focused research analysis driven by fundamental data. Note that our analysis may not factor in the latest price-sensitive company announcements or qualitative material.
If you spot an error that warrants correction, please contact the editor at editorial-team@simplywallst.com. This article by Simply Wall St is general in nature. It does not constitute a recommendation to buy or sell any stock, and does not take account of your objectives, or your financial situation. Simply Wall St has no position in the stocks mentioned. Thank you for reading.
