Why IGM Financial Inc.'s (TSE:IGM) High P/E Ratio Isn't Necessarily A Bad Thing

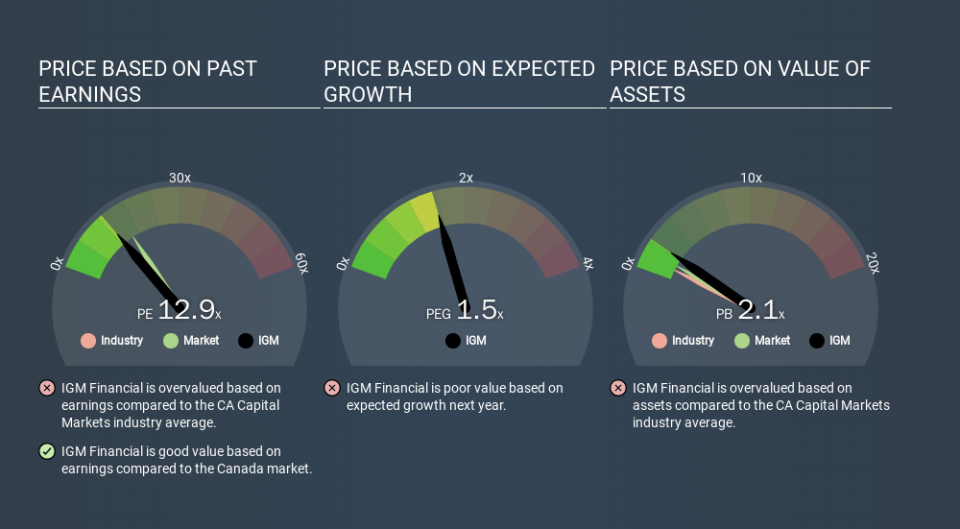
The goal of this article is to teach you how to use price to earnings ratios (P/E ratios). We'll show how you can use IGM Financial Inc.'s (TSE:IGM) P/E ratio to inform your assessment of the investment opportunity. IGM Financial has a price to earnings ratio of 12.85, based on the last twelve months. In other words, at today's prices, investors are paying CA$12.85 for every CA$1 in prior year profit.
View our latest analysis for IGM Financial
How Do You Calculate A P/E Ratio?
The formula for price to earnings is:
Price to Earnings Ratio = Price per Share ÷ Earnings per Share (EPS)
Or for IGM Financial:
P/E of 12.85 = CAD39.41 ÷ CAD3.07 (Based on the trailing twelve months to September 2019.)
Is A High P/E Ratio Good?
A higher P/E ratio implies that investors pay a higher price for the earning power of the business. All else being equal, it's better to pay a low price -- but as Warren Buffett said, 'It's far better to buy a wonderful company at a fair price than a fair company at a wonderful price'.
Does IGM Financial Have A Relatively High Or Low P/E For Its Industry?
We can get an indication of market expectations by looking at the P/E ratio. As you can see below IGM Financial has a P/E ratio that is fairly close for the average for the capital markets industry, which is 12.5.
That indicates that the market expects IGM Financial will perform roughly in line with other companies in its industry. The company could surprise by performing better than average, in the future. Checking factors such as director buying and selling. could help you form your own view on if that will happen.
How Growth Rates Impact P/E Ratios
P/E ratios primarily reflect market expectations around earnings growth rates. That's because companies that grow earnings per share quickly will rapidly increase the 'E' in the equation. That means unless the share price increases, the P/E will reduce in a few years. And as that P/E ratio drops, the company will look cheap, unless its share price increases.
Most would be impressed by IGM Financial earnings growth of 16% in the last year. And earnings per share have improved by 1.5% annually, over the last three years. With that performance, you might expect an above average P/E ratio.
A Limitation: P/E Ratios Ignore Debt and Cash In The Bank
Don't forget that the P/E ratio considers market capitalization. Thus, the metric does not reflect cash or debt held by the company. Theoretically, a business can improve its earnings (and produce a lower P/E in the future) by investing in growth. That means taking on debt (or spending its cash).
Such spending might be good or bad, overall, but the key point here is that you need to look at debt to understand the P/E ratio in context.
IGM Financial's Balance Sheet
Net debt totals 14% of IGM Financial's market cap. It would probably deserve a higher P/E ratio if it was net cash, since it would have more options for growth.
The Verdict On IGM Financial's P/E Ratio
IGM Financial trades on a P/E ratio of 12.9, which is below the CA market average of 15.8. The company hasn't stretched its balance sheet, and earnings growth was good last year. The low P/E ratio suggests current market expectations are muted, implying these levels of growth will not continue.
Investors should be looking to buy stocks that the market is wrong about. If it is underestimating a company, investors can make money by buying and holding the shares until the market corrects itself. So this free visualization of the analyst consensus on future earnings could help you make the right decision about whether to buy, sell, or hold.
But note: IGM Financial may not be the best stock to buy. So take a peek at this free list of interesting companies with strong recent earnings growth (and a P/E ratio below 20).
If you spot an error that warrants correction, please contact the editor at editorial-team@simplywallst.com. This article by Simply Wall St is general in nature. It does not constitute a recommendation to buy or sell any stock, and does not take account of your objectives, or your financial situation. Simply Wall St has no position in the stocks mentioned.
We aim to bring you long-term focused research analysis driven by fundamental data. Note that our analysis may not factor in the latest price-sensitive company announcements or qualitative material. Thank you for reading.
