Why You Should Like KABE Group AB (publ.)’s (STO:KABE B) ROCE

Want to participate in a short research study? Help shape the future of investing tools and you could win a $250 gift card!
Today we are going to look at KABE Group AB (publ.) (STO:KABE B) to see whether it might be an attractive investment prospect. Specifically, we'll consider its Return On Capital Employed (ROCE), since that will give us an insight into how efficiently the business can generate profits from the capital it requires.
First, we'll go over how we calculate ROCE. Second, we'll look at its ROCE compared to similar companies. And finally, we'll look at how its current liabilities are impacting its ROCE.
What is Return On Capital Employed (ROCE)?
ROCE measures the 'return' (pre-tax profit) a company generates from capital employed in its business. In general, businesses with a higher ROCE are usually better quality. Ultimately, it is a useful but imperfect metric. Renowned investment researcher Michael Mauboussin has suggested that a high ROCE can indicate that 'one dollar invested in the company generates value of more than one dollar'.
So, How Do We Calculate ROCE?
The formula for calculating the return on capital employed is:
Return on Capital Employed = Earnings Before Interest and Tax (EBIT) ÷ (Total Assets - Current Liabilities)
Or for KABE Group AB (publ.):
0.20 = kr224m ÷ (kr1.8b - kr703m) (Based on the trailing twelve months to March 2019.)
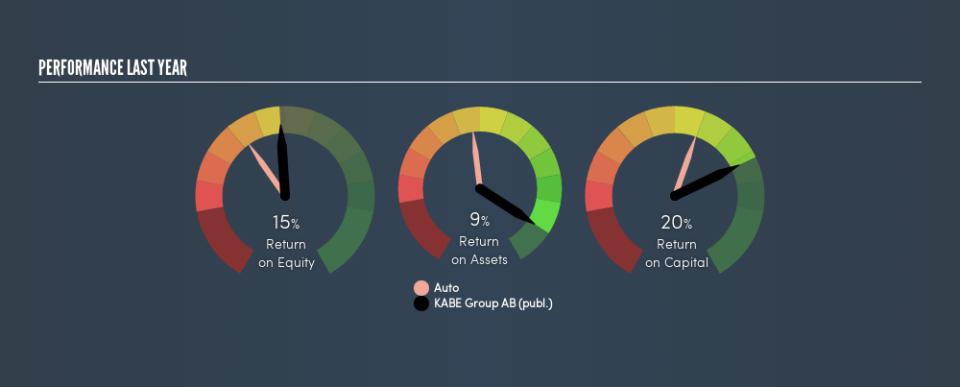
So, KABE Group AB (publ.) has an ROCE of 20%.
See our latest analysis for KABE Group AB (publ.)
Does KABE Group AB (publ.) Have A Good ROCE?
ROCE can be useful when making comparisons, such as between similar companies. In our analysis, KABE Group AB (publ.)'s ROCE is meaningfully higher than the 9.0% average in the Auto industry. I think that's good to see, since it implies the company is better than other companies at making the most of its capital. Putting aside its position relative to its industry for now, in absolute terms, KABE Group AB (publ.)'s ROCE is currently very good.
As we can see, KABE Group AB (publ.) currently has an ROCE of 20% compared to its ROCE 3 years ago, which was 14%. This makes us think the business might be improving.
When considering this metric, keep in mind that it is backwards looking, and not necessarily predictive. Companies in cyclical industries can be difficult to understand using ROCE, as returns typically look high during boom times, and low during busts. This is because ROCE only looks at one year, instead of considering returns across a whole cycle. If KABE Group AB (publ.) is cyclical, it could make sense to check out this free graph of past earnings, revenue and cash flow.
Do KABE Group AB (publ.)'s Current Liabilities Skew Its ROCE?
Liabilities, such as supplier bills and bank overdrafts, are referred to as current liabilities if they need to be paid within 12 months. Due to the way the ROCE equation works, having large bills due in the near term can make it look as though a company has less capital employed, and thus a higher ROCE than usual. To check the impact of this, we calculate if a company has high current liabilities relative to its total assets.
KABE Group AB (publ.) has total assets of kr1.8b and current liabilities of kr703m. Therefore its current liabilities are equivalent to approximately 38% of its total assets. A medium level of current liabilities boosts KABE Group AB (publ.)'s ROCE somewhat.
The Bottom Line On KABE Group AB (publ.)'s ROCE
Even so, it has a great ROCE, and could be an attractive prospect for further research. There might be better investments than KABE Group AB (publ.) out there, but you will have to work hard to find them . These promising businesses with rapidly growing earnings might be right up your alley.
If you like to buy stocks alongside management, then you might just love this free list of companies. (Hint: insiders have been buying them).
We aim to bring you long-term focused research analysis driven by fundamental data. Note that our analysis may not factor in the latest price-sensitive company announcements or qualitative material.
If you spot an error that warrants correction, please contact the editor at editorial-team@simplywallst.com. This article by Simply Wall St is general in nature. It does not constitute a recommendation to buy or sell any stock, and does not take account of your objectives, or your financial situation. Simply Wall St has no position in the stocks mentioned. Thank you for reading.
