Why Is Leggett & Platt (LEG) Down 2.6% Since its Last Earnings Report?

A month has gone by since the last earnings report for Leggett & Platt, Incorporated LEG. Shares have lost about 2.6% in that time frame.
Will the recent negative trend continue leading up to its next earnings release, or is LEG due for a breakout? Before we dive into how investors and analysts have reacted as of late, let's take a quick look at the most recent earnings report in order to get a better handle on the important catalysts.
Leggett Lags Q1 Earnings & Sales, Trims 2018 EPS View
Leggett & Platt reported lower-than-expected sales and earnings in first-quarter 2018. Also, the bottom line declined year over year. Notably, this marked the company’s fourth consecutive quarter of sales miss, while earnings lagged estimates for the second time. Further, management trimmed its earnings view for 2018 but raised the sales outlook.
The company’s quarterly adjusted earnings of 57 cents per share decreased 8.1% year over year and missed the Zacks Consensus Estimate of 61 cents. The year-over-year decline was due to increased raw material expenses.
On a GAAP basis, earnings per share came in at 57 cents compared with 62 cents in the prior-year quarter.
Delving Deeper
Although net sales increased about 7.1% to $1,028.8 million, it lagged the Zacks Consensus Estimate of $1,044 million. Including inter-segment sales, total sales came in at $1,107.4 million, up 6.6% year over year.
Improved sales were backed by 1% rise in volume and a 5% gain from raw material price inflation and currency. Furthermore, acquisitions contributed around 2% to sales, however, somewhat compensated with divestitures.
While gross profit dropped 4% year over year to $217.4 million, gross margin contracted 250 basis points (bps) to 21.1%. Also, the company’s adjusted EBIT margin declined 170 bps to 10.4% in the first quarter. In dollar terms, adjusted EBIT was down 7.3% to $107.4 million, due to the pricing lag and commodity inflation.
Segment Details
Residential Products’ sales (excluding inter-segment sales) of $398.1 million increased 1.7% from last year, driven by a marginal improvement in same location sales along with contributions from buyouts. Also, contributions of 4% from raw material price inflation and currency aided results. However, volumes dropped 3% on lower demand in Geo Components and Flooring Products as well as weak pass-through sales of adjustable beds. Including inter-segment sales, total sales for the segment rose 1.7% to $402.7 million.
The Industrial Products segment's sales improved 17.5% to $82 million. Total sales, including inter-segment sales, were up 12.6% to $152.4 million, mainly driven by raw material price inflation.
Sales at Furniture Products increased 6.2% to $281.3 million, courtesy of benefits from higher Adjustable Bed sales and a 3% rise in same location sales. Additionally, the segment gained from a small acquisition in Work Furniture. This was somewhat negated by declines in Home Furniture and Fashion Bed. However, total sales for the segment (including inter-segment sales) grew 4.8% to $284.2 million.
The Specialized Products segment's sales rose 14.1% to $267.4 million. Same location sales climbed 11% backed by solid Automotive volumes and favorable currency impact. Also, the Precision Hydraulic Cylinders’ (PHC) acquisition added nearly 6% to sales growth, which was offset by a 4% impact from the divestiture of CVP. Total sales for the segment (including inter-segment sales) climbed 13.5% to $268.1 million.
Financials
Leggett ended first quarter with cash and cash equivalents of $494.6 million, and long-term debt of $1,239 million. Furthermore, the company generated $44.1 million in cash flow from operations in the same period.
The company had net debt to net capital ratio of 38% at the end of the first quarter, within the company’s 30-40% target range. Moreover, Leggett’s debt was 2.4 times of trailing 12-month adjusted EBITDA.
In addition, management repurchased nearly 1.2 million shares for an average price of $45.09 and issued 0.5 million shares through employee benefit plans and option exercises. Also, it declared a quarterly dividend of 36 cents per share, reflecting an increase of two cents from the year-ago period. This marks Leggett’s 47th consecutive year of dividend increase.
Guidance
Leggett has been significantly gaining from inflation and currency, which have been aiding its top line. Further, management remains optimistic about growth opportunities in the Bedding business and projects market improvements as the year progresses. However, the ongoing steel costs inflation has been largely weighing on its margins, which is likely to continue hurting margins in the second quarter.
Following the soft quarterly results, management updated its guidance for 2018. Sales are now projected to grow nearly 9-12% year over year to $4.3-$4.4 billion, up $100 million from the previously guided range of $4.2-$4.3. The raised top-line guidance was backed by continued steel inflation. The company’s solid sales view is backed by expectations of mid-single-digit volume growth, raw material price increases and favorable currency. Additionally, the PHC acquisition is likely to contribute 2% to sales growth.
Consequently, EBIT margin is envisioned to be nearly 11.5-12% compared with 12-12.5%, guided earlier. However, on assuming that costs will stabilize, Leggett predicts margins to improve through the second half of 2018.
Based on above iterations, management projects earnings from continuing operations in the range of $2.60-$2.80 per share, down 5 cents from $2.65-$2.85 projected earlier. The downside can be attributed to adverse impacts of continued steel cost inflation as well as the pricing lag for recovering greater costs. Notably, this guidance takes into account an effective tax rate of 22%.
Additionally, the company seems to be continuing with its trend of generating more cash to fund dividends and capital expenditures. For 2018, Leggett expects operating cash flows of about $450 million compared with $500 million anticipated earlier. Capital expenditures for the year are still projected at $160 million, while the company intends to spend $195 million toward dividend payouts. The company also outlined the target dividend payout ratio to be 50-60% of adjusted earnings. Furthermore, it expects payout for 2018 to be near the midpoint of the aforementioned range.
Meanwhile, management plans to continue with its share repurchase program, having a standing authorization to buy back up to 10 million shares every year, after fulfilling all priority requirements. For 2018, the company also intends to repurchase nearly 2-3 million shares and issue about 1 million shares primarily for employee benefit plans.
How Have Estimates Been Moving Since Then?
In the past month, investors have witnessed a downward trend in fresh estimates. There have been four revisions lower for the current quarter. In the past month, the consensus estimate has shifted downward by 12.8% due to these changes.
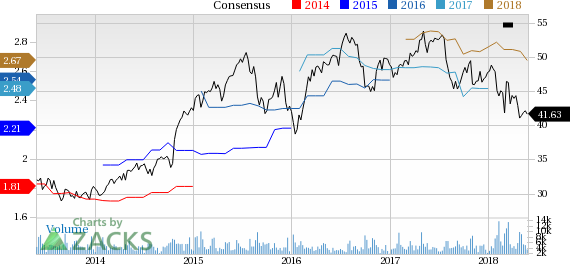
Leggett & Platt, Incorporated Price and Consensus
Leggett & Platt, Incorporated Price and Consensus | Leggett & Platt, Incorporated Quote
VGM Scores
At this time, LEG has a subpar Growth Score of D, a grade with the same score on the momentum front. However, the stock was allocated a grade of B on the value side, putting it in the second quintile for this investment strategy.
Overall, the stock has an aggregate VGM Score of D. If you aren't focused on one strategy, this score is the one you should be interested in.
The company's stock is suitable solely for value based on our styles scores.
Outlook
Estimates have been broadly trending downward for the stock and the magnitude of these revisions indicates a downward shift. It's no surprise LEG has a Zacks Rank #4 (Sell). We expect a below average return from the stock in the next few months.
Want the latest recommendations from Zacks Investment Research? Today, you can download 7 Best Stocks for the Next 30 Days. Click to get this free report
Leggett & Platt, Incorporated (LEG) : Free Stock Analysis Report
To read this article on Zacks.com click here.
Zacks Investment Research
