Why Mewah International Inc.’s (SGX:MV4) Return On Capital Employed Might Be A Concern

Today we'll evaluate Mewah International Inc. (SGX:MV4) to determine whether it could have potential as an investment idea. In particular, we'll consider its Return On Capital Employed (ROCE), as that can give us insight into how profitably the company is able to employ capital in its business.
Firstly, we'll go over how we calculate ROCE. Next, we'll compare it to others in its industry. Then we'll determine how its current liabilities are affecting its ROCE.
Return On Capital Employed (ROCE): What is it?
ROCE measures the amount of pre-tax profits a company can generate from the capital employed in its business. In general, businesses with a higher ROCE are usually better quality. Overall, it is a valuable metric that has its flaws. Author Edwin Whiting says to be careful when comparing the ROCE of different businesses, since 'No two businesses are exactly alike.'
How Do You Calculate Return On Capital Employed?
Analysts use this formula to calculate return on capital employed:
Return on Capital Employed = Earnings Before Interest and Tax (EBIT) ÷ (Total Assets - Current Liabilities)
Or for Mewah International:
0.045 = US$27m ÷ (US$1.3b - US$657m) (Based on the trailing twelve months to March 2019.)
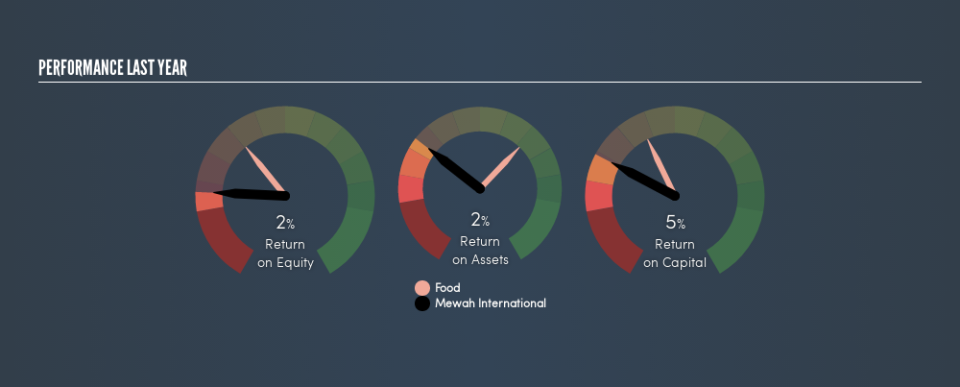
So, Mewah International has an ROCE of 4.5%.
Want to participate in a short research study? Help shape the future of investing tools and you could win a $250 gift card!
Check out our latest analysis for Mewah International
Is Mewah International's ROCE Good?
ROCE is commonly used for comparing the performance of similar businesses. We can see Mewah International's ROCE is meaningfully below the Food industry average of 8.0%. This performance is not ideal, as it suggests the company may not be deploying its capital as effectively as some competitors. Independently of how Mewah International compares to its industry, its ROCE in absolute terms is low; especially compared to the ~2.3% available in government bonds. Readers may wish to look for more rewarding investments.
Mewah International's current ROCE of 4.5% is lower than 3 years ago, when the company reported a 8.9% ROCE. Therefore we wonder if the company is facing new headwinds.
When considering ROCE, bear in mind that it reflects the past and does not necessarily predict the future. Companies in cyclical industries can be difficult to understand using ROCE, as returns typically look high during boom times, and low during busts. ROCE is, after all, simply a snap shot of a single year. How cyclical is Mewah International? You can see for yourself by looking at this free graph of past earnings, revenue and cash flow.
What Are Current Liabilities, And How Do They Affect Mewah International's ROCE?
Current liabilities are short term bills and invoices that need to be paid in 12 months or less. Due to the way ROCE is calculated, a high level of current liabilities makes a company look as though it has less capital employed, and thus can (sometimes unfairly) boost the ROCE. To check the impact of this, we calculate if a company has high current liabilities relative to its total assets.
Mewah International has total liabilities of US$657m and total assets of US$1.3b. As a result, its current liabilities are equal to approximately 52% of its total assets. This is a fairly high level of current liabilities, boosting Mewah International's ROCE.
The Bottom Line On Mewah International's ROCE
Unfortunately, its ROCE is also pretty low, so we are cautious about the stock. But note: make sure you look for a great company, not just the first idea you come across. So take a peek at this free list of interesting companies with strong recent earnings growth (and a P/E ratio below 20).
If you like to buy stocks alongside management, then you might just love this free list of companies. (Hint: insiders have been buying them).
We aim to bring you long-term focused research analysis driven by fundamental data. Note that our analysis may not factor in the latest price-sensitive company announcements or qualitative material.
If you spot an error that warrants correction, please contact the editor at editorial-team@simplywallst.com. This article by Simply Wall St is general in nature. It does not constitute a recommendation to buy or sell any stock, and does not take account of your objectives, or your financial situation. Simply Wall St has no position in the stocks mentioned. Thank you for reading.
