Why We’re Not Impressed By Cass Information Systems, Inc.’s (NASDAQ:CASS) 5.3% ROCE

Today we are going to look at Cass Information Systems, Inc. (NASDAQ:CASS) to see whether it might be an attractive investment prospect. In particular, we'll consider its Return On Capital Employed (ROCE), as that can give us insight into how profitably the company is able to employ capital in its business.
First of all, we'll work out how to calculate ROCE. Next, we'll compare it to others in its industry. Last but not least, we'll look at what impact its current liabilities have on its ROCE.
Understanding Return On Capital Employed (ROCE)
ROCE measures the amount of pre-tax profits a company can generate from the capital employed in its business. All else being equal, a better business will have a higher ROCE. Ultimately, it is a useful but imperfect metric. Renowned investment researcher Michael Mauboussin has suggested that a high ROCE can indicate that 'one dollar invested in the company generates value of more than one dollar'.
So, How Do We Calculate ROCE?
Analysts use this formula to calculate return on capital employed:
Return on Capital Employed = Earnings Before Interest and Tax (EBIT) ÷ (Total Assets - Current Liabilities)
Or for Cass Information Systems:
0.053 = US$37m ÷ (US$1.8b - US$1.1b) (Based on the trailing twelve months to December 2019.)
Therefore, Cass Information Systems has an ROCE of 5.3%.
Check out our latest analysis for Cass Information Systems
Is Cass Information Systems's ROCE Good?
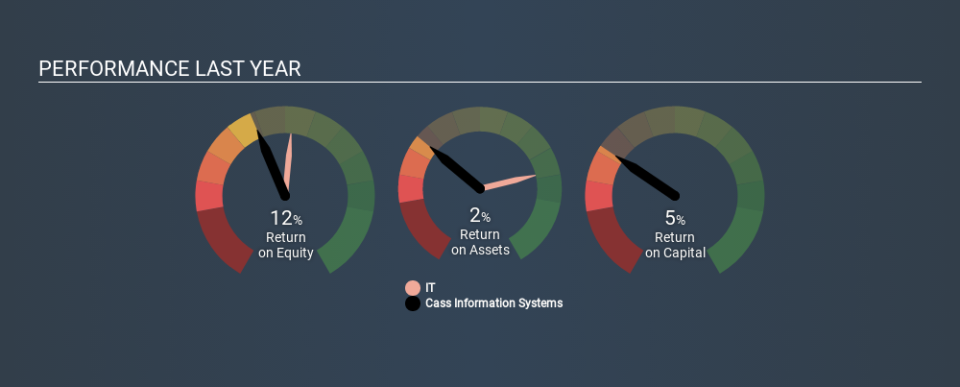
ROCE is commonly used for comparing the performance of similar businesses. We can see Cass Information Systems's ROCE is meaningfully below the IT industry average of 11%. This performance is not ideal, as it suggests the company may not be deploying its capital as effectively as some competitors. Aside from the industry comparison, Cass Information Systems's ROCE is mediocre in absolute terms, considering the risk of investing in stocks versus the safety of a bank account. Investors may wish to consider higher-performing investments.
You can see in the image below how Cass Information Systems's ROCE compares to its industry. Click to see more on past growth.
It is important to remember that ROCE shows past performance, and is not necessarily predictive. ROCE can be deceptive for cyclical businesses, as returns can look incredible in boom times, and terribly low in downturns. ROCE is, after all, simply a snap shot of a single year. You can check if Cass Information Systems has cyclical profits by looking at this free graph of past earnings, revenue and cash flow.
How Cass Information Systems's Current Liabilities Impact Its ROCE
Current liabilities include invoices, such as supplier payments, short-term debt, or a tax bill, that need to be paid within 12 months. Due to the way ROCE is calculated, a high level of current liabilities makes a company look as though it has less capital employed, and thus can (sometimes unfairly) boost the ROCE. To check the impact of this, we calculate if a company has high current liabilities relative to its total assets.
Cass Information Systems has total assets of US$1.8b and current liabilities of US$1.1b. As a result, its current liabilities are equal to approximately 60% of its total assets. Cass Information Systems has a fairly high level of current liabilities, meaningfully impacting its ROCE.
The Bottom Line On Cass Information Systems's ROCE
Notably, it also has a mediocre ROCE, which to my mind is not an appealing combination. But note: make sure you look for a great company, not just the first idea you come across. So take a peek at this free list of interesting companies with strong recent earnings growth (and a P/E ratio below 20).
I will like Cass Information Systems better if I see some big insider buys. While we wait, check out this free list of growing companies with considerable, recent, insider buying.
If you spot an error that warrants correction, please contact the editor at editorial-team@simplywallst.com. This article by Simply Wall St is general in nature. It does not constitute a recommendation to buy or sell any stock, and does not take account of your objectives, or your financial situation. Simply Wall St has no position in the stocks mentioned.
We aim to bring you long-term focused research analysis driven by fundamental data. Note that our analysis may not factor in the latest price-sensitive company announcements or qualitative material. Thank you for reading.
