Why We’re Not Keen On Lindsay Corporation’s (NYSE:LNN) 2.1% Return On Capital

Today we'll look at Lindsay Corporation (NYSE:LNN) and reflect on its potential as an investment. In particular, we'll consider its Return On Capital Employed (ROCE), as that can give us insight into how profitably the company is able to employ capital in its business.
First up, we'll look at what ROCE is and how we calculate it. Next, we'll compare it to others in its industry. Finally, we'll look at how its current liabilities affect its ROCE.
Understanding Return On Capital Employed (ROCE)
ROCE measures the amount of pre-tax profits a company can generate from the capital employed in its business. In general, businesses with a higher ROCE are usually better quality. Overall, it is a valuable metric that has its flaws. Renowned investment researcher Michael Mauboussin has suggested that a high ROCE can indicate that 'one dollar invested in the company generates value of more than one dollar'.
How Do You Calculate Return On Capital Employed?
Analysts use this formula to calculate return on capital employed:
Return on Capital Employed = Earnings Before Interest and Tax (EBIT) ÷ (Total Assets - Current Liabilities)
Or for Lindsay:
0.021 = US$8.6m ÷ (US$506m - US$87m) (Based on the trailing twelve months to May 2019.)
So, Lindsay has an ROCE of 2.1%.
See our latest analysis for Lindsay
Does Lindsay Have A Good ROCE?
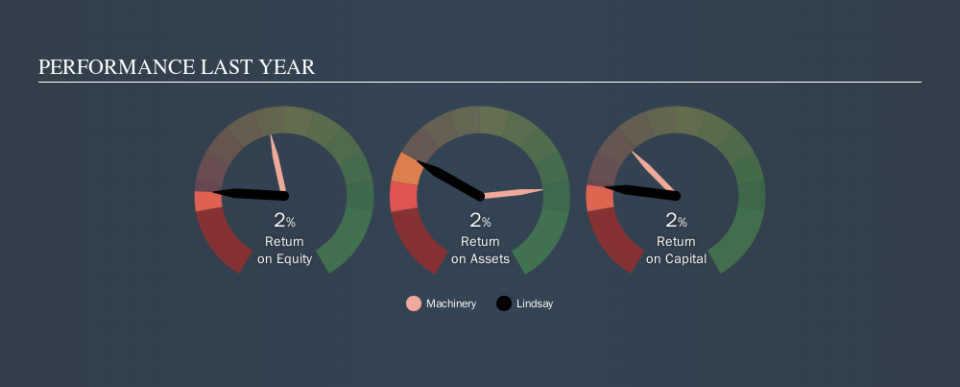
One way to assess ROCE is to compare similar companies. We can see Lindsay's ROCE is meaningfully below the Machinery industry average of 12%. This could be seen as a negative, as it suggests some competitors may be employing their capital more efficiently. Independently of how Lindsay compares to its industry, its ROCE in absolute terms is low; especially compared to the ~2.7% available in government bonds. There are potentially more appealing investments elsewhere.
Lindsay's current ROCE of 2.1% is lower than 3 years ago, when the company reported a 6.7% ROCE. So investors might consider if it has had issues recently. The image below shows how Lindsay's ROCE compares to its industry, and you can click it to see more detail on its past growth.
Remember that this metric is backwards looking - it shows what has happened in the past, and does not accurately predict the future. ROCE can be deceptive for cyclical businesses, as returns can look incredible in boom times, and terribly low in downturns. This is because ROCE only looks at one year, instead of considering returns across a whole cycle. Future performance is what matters, and you can see analyst predictions in our free report on analyst forecasts for the company.
How Lindsay's Current Liabilities Impact Its ROCE
Current liabilities are short term bills and invoices that need to be paid in 12 months or less. Due to the way the ROCE equation works, having large bills due in the near term can make it look as though a company has less capital employed, and thus a higher ROCE than usual. To check the impact of this, we calculate if a company has high current liabilities relative to its total assets.
Lindsay has total liabilities of US$87m and total assets of US$506m. As a result, its current liabilities are equal to approximately 17% of its total assets. This is a modest level of current liabilities, which will have a limited impact on the ROCE.
What We Can Learn From Lindsay's ROCE
While that is good to see, Lindsay has a low ROCE and does not look attractive in this analysis. You might be able to find a better investment than Lindsay. If you want a selection of possible winners, check out this free list of interesting companies that trade on a P/E below 20 (but have proven they can grow earnings).
If you like to buy stocks alongside management, then you might just love this free list of companies. (Hint: insiders have been buying them).
We aim to bring you long-term focused research analysis driven by fundamental data. Note that our analysis may not factor in the latest price-sensitive company announcements or qualitative material.
If you spot an error that warrants correction, please contact the editor at editorial-team@simplywallst.com. This article by Simply Wall St is general in nature. It does not constitute a recommendation to buy or sell any stock, and does not take account of your objectives, or your financial situation. Simply Wall St has no position in the stocks mentioned. Thank you for reading.
