Why We’re Not Keen On Munters Group AB (publ)’s (STO:MTRS) 7.3% Return On Capital

Today we'll evaluate Munters Group AB (publ) (STO:MTRS) to determine whether it could have potential as an investment idea. To be precise, we'll consider its Return On Capital Employed (ROCE), as that will inform our view of the quality of the business.
First, we'll go over how we calculate ROCE. Next, we'll compare it to others in its industry. And finally, we'll look at how its current liabilities are impacting its ROCE.
What is Return On Capital Employed (ROCE)?
ROCE measures the 'return' (pre-tax profit) a company generates from capital employed in its business. In general, businesses with a higher ROCE are usually better quality. Ultimately, it is a useful but imperfect metric. Author Edwin Whiting says to be careful when comparing the ROCE of different businesses, since 'No two businesses are exactly alike.
How Do You Calculate Return On Capital Employed?
The formula for calculating the return on capital employed is:
Return on Capital Employed = Earnings Before Interest and Tax (EBIT) ÷ (Total Assets - Current Liabilities)
Or for Munters Group:
0.073 = kr627m ÷ (kr11b - kr2.3b) (Based on the trailing twelve months to March 2020.)
So, Munters Group has an ROCE of 7.3%.
View our latest analysis for Munters Group
Is Munters Group's ROCE Good?
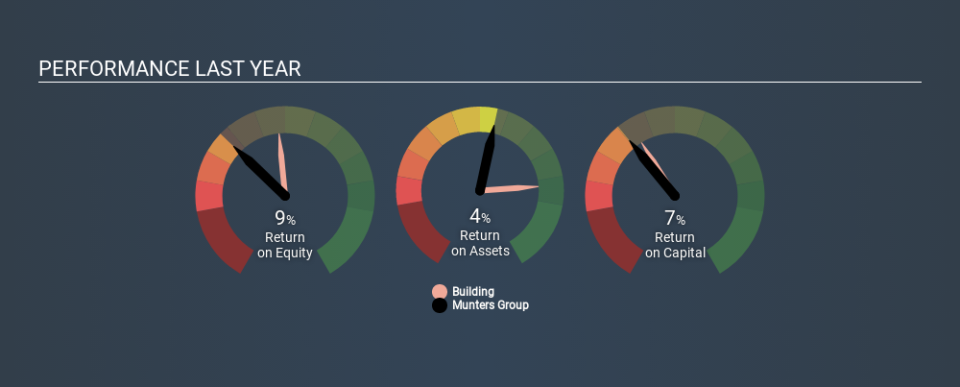
ROCE can be useful when making comparisons, such as between similar companies. We can see Munters Group's ROCE is meaningfully below the Building industry average of 13%. This performance is not ideal, as it suggests the company may not be deploying its capital as effectively as some competitors. Aside from the industry comparison, Munters Group's ROCE is mediocre in absolute terms, considering the risk of investing in stocks versus the safety of a bank account. Readers may find more attractive investment prospects elsewhere.
The image below shows how Munters Group's ROCE compares to its industry, and you can click it to see more detail on its past growth.
When considering this metric, keep in mind that it is backwards looking, and not necessarily predictive. ROCE can be deceptive for cyclical businesses, as returns can look incredible in boom times, and terribly low in downturns. ROCE is only a point-in-time measure. Future performance is what matters, and you can see analyst predictions in our free report on analyst forecasts for the company.
What Are Current Liabilities, And How Do They Affect Munters Group's ROCE?
Current liabilities are short term bills and invoices that need to be paid in 12 months or less. Due to the way ROCE is calculated, a high level of current liabilities makes a company look as though it has less capital employed, and thus can (sometimes unfairly) boost the ROCE. To counteract this, we check if a company has high current liabilities, relative to its total assets.
Munters Group has total assets of kr11b and current liabilities of kr2.3b. As a result, its current liabilities are equal to approximately 21% of its total assets. This very reasonable level of current liabilities would not boost the ROCE by much.
What We Can Learn From Munters Group's ROCE
If Munters Group continues to earn an uninspiring ROCE, there may be better places to invest. Of course, you might also be able to find a better stock than Munters Group. So you may wish to see this free collection of other companies that have grown earnings strongly.
Munters Group is not the only stock insiders are buying. So take a peek at this free list of growing companies with insider buying.
If you spot an error that warrants correction, please contact the editor at editorial-team@simplywallst.com. This article by Simply Wall St is general in nature. It does not constitute a recommendation to buy or sell any stock, and does not take account of your objectives, or your financial situation. Simply Wall St has no position in the stocks mentioned.
We aim to bring you long-term focused research analysis driven by fundamental data. Note that our analysis may not factor in the latest price-sensitive company announcements or qualitative material. Thank you for reading.
