Why O-Net Technologies (Group) Limited’s (HKG:877) Return On Capital Employed Is Impressive

Today we'll look at O-Net Technologies (Group) Limited (HKG:877) and reflect on its potential as an investment. To be precise, we'll consider its Return On Capital Employed (ROCE), as that will inform our view of the quality of the business.
First up, we'll look at what ROCE is and how we calculate it. Next, we'll compare it to others in its industry. And finally, we'll look at how its current liabilities are impacting its ROCE.
Return On Capital Employed (ROCE): What is it?
ROCE is a measure of a company's yearly pre-tax profit (its return), relative to the capital employed in the business. In general, businesses with a higher ROCE are usually better quality. Overall, it is a valuable metric that has its flaws. Renowned investment researcher Michael Mauboussin has suggested that a high ROCE can indicate that 'one dollar invested in the company generates value of more than one dollar'.
So, How Do We Calculate ROCE?
Analysts use this formula to calculate return on capital employed:
Return on Capital Employed = Earnings Before Interest and Tax (EBIT) ÷ (Total Assets - Current Liabilities)
Or for O-Net Technologies (Group):
0.13 = HK$322m ÷ (HK$3.6b - HK$1.1b) (Based on the trailing twelve months to June 2019.)
Therefore, O-Net Technologies (Group) has an ROCE of 13%.
View our latest analysis for O-Net Technologies (Group)
Does O-Net Technologies (Group) Have A Good ROCE?
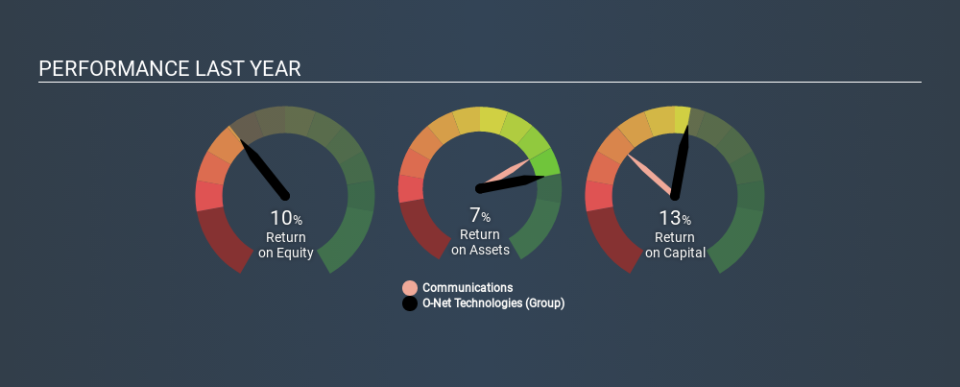
One way to assess ROCE is to compare similar companies. Using our data, we find that O-Net Technologies (Group)'s ROCE is meaningfully better than the 9.0% average in the Communications industry. We consider this a positive sign, because it suggests it uses capital more efficiently than similar companies. Separate from O-Net Technologies (Group)'s performance relative to its industry, its ROCE in absolute terms looks satisfactory, and it may be worth researching in more depth.
Our data shows that O-Net Technologies (Group) currently has an ROCE of 13%, compared to its ROCE of 6.2% 3 years ago. This makes us wonder if the company is improving. You can see in the image below how O-Net Technologies (Group)'s ROCE compares to its industry. Click to see more on past growth.
When considering ROCE, bear in mind that it reflects the past and does not necessarily predict the future. ROCE can be deceptive for cyclical businesses, as returns can look incredible in boom times, and terribly low in downturns. ROCE is, after all, simply a snap shot of a single year. Since the future is so important for investors, you should check out our free report on analyst forecasts for O-Net Technologies (Group).
What Are Current Liabilities, And How Do They Affect O-Net Technologies (Group)'s ROCE?
Current liabilities are short term bills and invoices that need to be paid in 12 months or less. Due to the way ROCE is calculated, a high level of current liabilities makes a company look as though it has less capital employed, and thus can (sometimes unfairly) boost the ROCE. To check the impact of this, we calculate if a company has high current liabilities relative to its total assets.
O-Net Technologies (Group) has total assets of HK$3.6b and current liabilities of HK$1.1b. Therefore its current liabilities are equivalent to approximately 32% of its total assets. With this level of current liabilities, O-Net Technologies (Group)'s ROCE is boosted somewhat.
Our Take On O-Net Technologies (Group)'s ROCE
O-Net Technologies (Group)'s ROCE does look good, but the level of current liabilities also contribute to that. There might be better investments than O-Net Technologies (Group) out there, but you will have to work hard to find them . These promising businesses with rapidly growing earnings might be right up your alley.
I will like O-Net Technologies (Group) better if I see some big insider buys. While we wait, check out this free list of growing companies with considerable, recent, insider buying.
If you spot an error that warrants correction, please contact the editor at editorial-team@simplywallst.com. This article by Simply Wall St is general in nature. It does not constitute a recommendation to buy or sell any stock, and does not take account of your objectives, or your financial situation. Simply Wall St has no position in the stocks mentioned.
We aim to bring you long-term focused research analysis driven by fundamental data. Note that our analysis may not factor in the latest price-sensitive company announcements or qualitative material. Thank you for reading.
