Why Silgan Holdings Inc.'s (NASDAQ:SLGN) High P/E Ratio Isn't Necessarily A Bad Thing

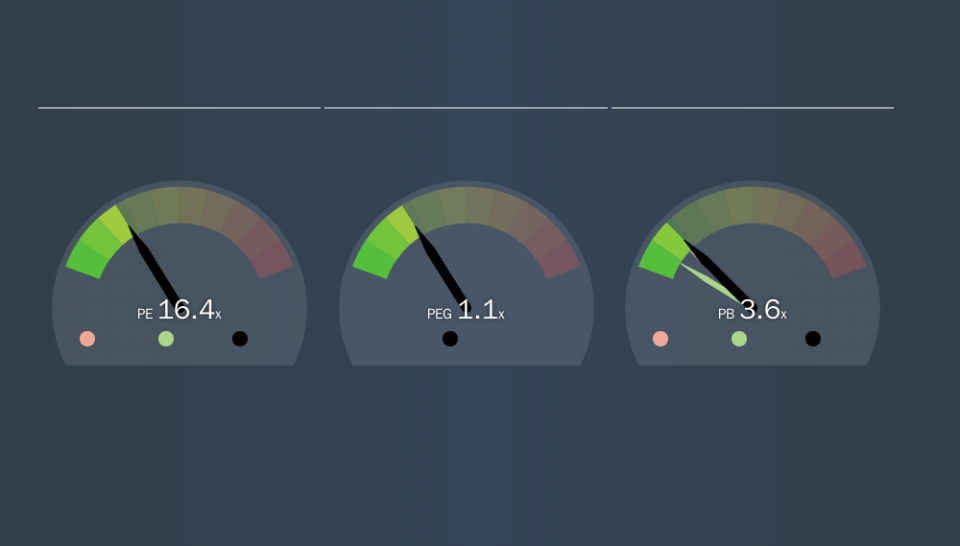
This article is written for those who want to get better at using price to earnings ratios (P/E ratios). We'll apply a basic P/E ratio analysis to Silgan Holdings Inc.'s (NASDAQ:SLGN), to help you decide if the stock is worth further research. What is Silgan Holdings's P/E ratio? Well, based on the last twelve months it is 16.42. In other words, at today's prices, investors are paying $16.42 for every $1 in prior year profit.
View our latest analysis for Silgan Holdings
How Do You Calculate A P/E Ratio?
The formula for P/E is:
Price to Earnings Ratio = Share Price ÷ Earnings per Share (EPS)
Or for Silgan Holdings:
P/E of 16.42 = $29.73 ÷ $1.81 (Based on the year to June 2019.)
Is A High Price-to-Earnings Ratio Good?
A higher P/E ratio means that investors are paying a higher price for each $1 of company earnings. That isn't a good or a bad thing on its own, but a high P/E means that buyers have a higher opinion of the business's prospects, relative to stocks with a lower P/E.
How Does Silgan Holdings's P/E Ratio Compare To Its Peers?
The P/E ratio essentially measures market expectations of a company. You can see in the image below that the average P/E (16.4) for companies in the packaging industry is roughly the same as Silgan Holdings's P/E.
That indicates that the market expects Silgan Holdings will perform roughly in line with other companies in its industry. So if Silgan Holdings actually outperforms its peers going forward, that should be a positive for the share price. Further research into factors such as insider buying and selling, could help you form your own view on whether that is likely.
How Growth Rates Impact P/E Ratios
Earnings growth rates have a big influence on P/E ratios. When earnings grow, the 'E' increases, over time. Therefore, even if you pay a high multiple of earnings now, that multiple will become lower in the future. So while a stock may look expensive based on past earnings, it could be cheap based on future earnings.
Silgan Holdings saw earnings per share decrease by 37% last year. But it has grown its earnings per share by 5.5% per year over the last five years.
Don't Forget: The P/E Does Not Account For Debt or Bank Deposits
One drawback of using a P/E ratio is that it considers market capitalization, but not the balance sheet. So it won't reflect the advantage of cash, or disadvantage of debt. Theoretically, a business can improve its earnings (and produce a lower P/E in the future) by investing in growth. That means taking on debt (or spending its cash).
While growth expenditure doesn't always pay off, the point is that it is a good option to have; but one that the P/E ratio ignores.
So What Does Silgan Holdings's Balance Sheet Tell Us?
Silgan Holdings's net debt is 78% of its market cap. This is enough debt that you'd have to make some adjustments before using the P/E ratio to compare it to a company with net cash.
The Bottom Line On Silgan Holdings's P/E Ratio
Silgan Holdings's P/E is 16.4 which is about average (17.3) in the US market. With meaningful debt, and no earnings per share growth last year, even an average P/E indicates that the market a significant improvement from the business.
Investors should be looking to buy stocks that the market is wrong about. As value investor Benjamin Graham famously said, 'In the short run, the market is a voting machine but in the long run, it is a weighing machine.' So this free report on the analyst consensus forecasts could help you make a master move on this stock.
Of course you might be able to find a better stock than Silgan Holdings. So you may wish to see this free collection of other companies that have grown earnings strongly.
We aim to bring you long-term focused research analysis driven by fundamental data. Note that our analysis may not factor in the latest price-sensitive company announcements or qualitative material.
If you spot an error that warrants correction, please contact the editor at editorial-team@simplywallst.com. This article by Simply Wall St is general in nature. It does not constitute a recommendation to buy or sell any stock, and does not take account of your objectives, or your financial situation. Simply Wall St has no position in the stocks mentioned. Thank you for reading.
