Why Smartsheet Inc's Stock Skyrocketed 11% in a Quarter
Smartsheet Inc (NYSE:SMAR), a prominent player in the software industry, has seen a significant surge in its stock price over the past quarter. The company's stock price currently stands at $43.42, with a market cap of $5.87 billion. Over the past week, the stock has seen an impressive gain of 8.96%, and over the past three months, it has risen by 11.06%. This performance is particularly noteworthy when considering the company's GF Value, which is currently $83.52, down from $109.08 three months ago. Despite this decrease, the stock's GF Valuation has remained 'Significantly Undervalued' for the past three months, indicating a potential opportunity for investors.
Understanding Smartsheet Inc
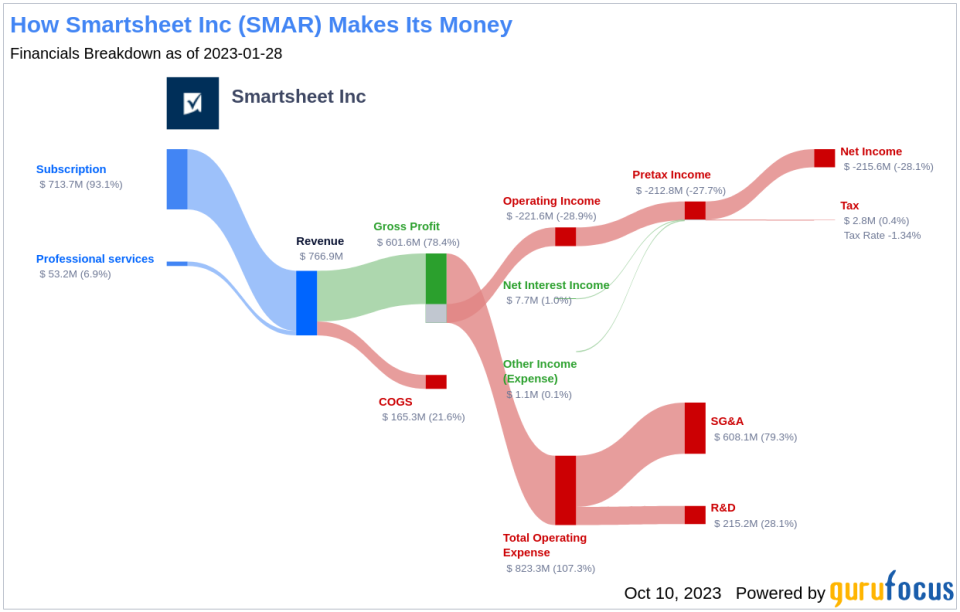
Smartsheet Inc operates in the software industry, providing a cloud-based platform for work execution. This platform enables teams and organizations to plan, capture, manage, automate, and report on work at a scale that results in more efficient processes and efficient business outcomes. The company offers various services such as Streamline Facilities Management, Manages Customer Experiences, Manages Budget and planning, and other related services. The majority of its revenue comes from subscriptions. Geographically, it operates in the United States, EMEA, Asia, and the Americas other than the United States, with the majority of its revenue generated from the United States.
Profitability Analysis
As of July 31, 2023, Smartsheet Inc's Profitability Rank stands at 3/10. The company's Operating Margin is -17.90%, which is better than 26.92% of 2756 companies in the same industry. The company's ROE is -29.46%, better than 20.73% of 2648 companies, and its ROA is -13.55%, better than 25.8% of 2814 companies. Furthermore, its ROIC is -18.29%, better than 24.82% of 2812 companies.
Growth Prospects
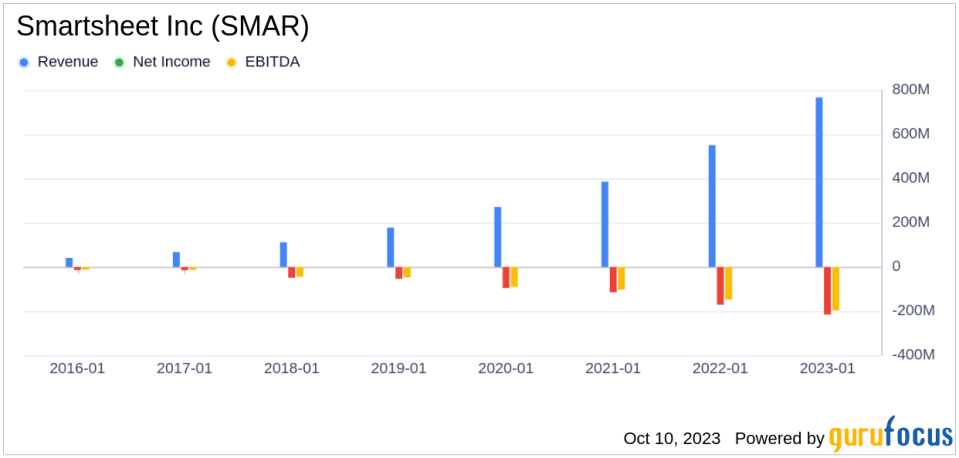
Smartsheet Inc's Growth Rank is 6/10 as of today. The company's 3-year and 5-year revenue growth rates per share are 35.00% and 6.70% respectively, better than 87.69% and 51.03% of companies in the same industry. The company's future total revenue growth rate estimate is 21.83%, better than 83.07% of 502 companies. However, the company's 3-year and 5-year EPS without NRI growth rates are -25.00% and 1.50% respectively, indicating a need for improvement in earnings growth.
Top Holders of Smartsheet Inc
The top three holders of Smartsheet Inc's stock are Jim Simons (Trades, Portfolio), Ron Baron (Trades, Portfolio), and Lee Ainslie (Trades, Portfolio). Jim Simons (Trades, Portfolio) holds 755,300 shares, representing 0.57% of the total shares, while Ron Baron (Trades, Portfolio) holds 518,882 shares, representing 0.39% of the total shares. Lee Ainslie (Trades, Portfolio) holds a smaller stake of 15,864 shares, representing 0.01% of the total shares.
Competitive Landscape
Smartsheet Inc operates in a competitive industry with major players such as National Instruments Corp (NASDAQ:NATI) with a market cap of $7.97 billion, Paycor HCM Inc (NASDAQ:PYCR) with a market cap of $4.38 billion, and Monday.Com Ltd (NASDAQ:MNDY) with a market cap of $7.44 billion.
Conclusion
In conclusion, Smartsheet Inc's stock performance over the past quarter has been impressive, with a significant surge in its stock price. Despite a decrease in its GF Value, the stock remains 'Significantly Undervalued', indicating a potential opportunity for investors. The company's profitability rank and growth rank suggest a mixed performance, with room for improvement in earnings growth. However, with top investors holding significant stakes and a competitive position in the industry, Smartsheet Inc presents an interesting case for potential investors.
This article, generated by GuruFocus, is designed to provide general insights and is not tailored financial advice. Our commentary is rooted in historical data and analyst projections, utilizing an impartial methodology, and is not intended to serve as specific investment guidance. It does not formulate a recommendation to purchase or divest any stock and does not consider individual investment objectives or financial circumstances. Our objective is to deliver long-term, fundamental data-driven analysis. Be aware that our analysis might not incorporate the most recent, price-sensitive company announcements or qualitative information. GuruFocus holds no position in the stocks mentioned herein.
This article first appeared on GuruFocus.
