Why Super Micro Computer Inc (NASDAQ:SMCI) Delivered An Inferior ROE Compared To The Industry

This analysis is intended to introduce important early concepts to people who are starting to invest and want to better understand how you can grow your money by investing in Super Micro Computer Inc (NASDAQ:SMCI).
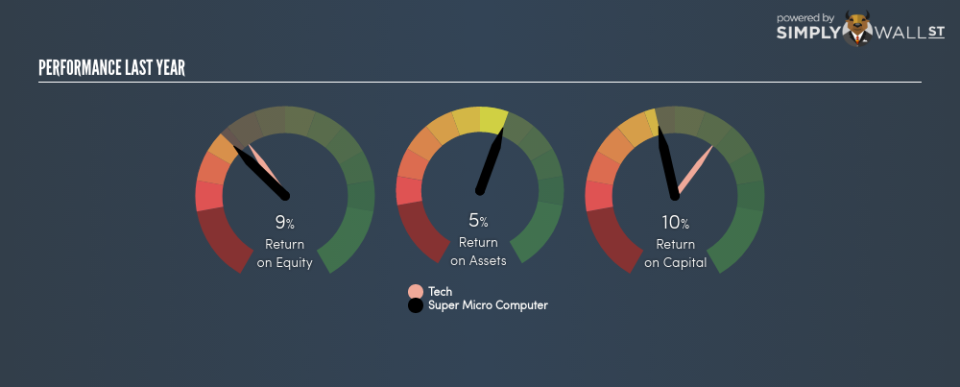
Super Micro Computer Inc (NASDAQ:SMCI) generated a below-average return on equity of 8.66% in the past 12 months, while its industry returned 10.35%. Though SMCI’s recent performance is underwhelming, it is useful to understand what ROE is made up of and how it should be interpreted. Knowing these components can change your views on SMCI’s below-average returns. Today I will look at how components such as financial leverage can influence ROE which may impact the sustainability of SMCI’s returns. Check out our latest analysis for Super Micro Computer
What you must know about ROE
Return on Equity (ROE) is a measure of Super Micro Computer’s profit relative to its shareholders’ equity. It essentially shows how much the company can generate in earnings given the amount of equity it has raised. While a higher ROE is preferred in most cases, there are several other factors we should consider before drawing any conclusions.
Return on Equity = Net Profit ÷ Shareholders Equity
Returns are usually compared to costs to measure the efficiency of capital. Super Micro Computer’s cost of equity is 10.58%. This means Super Micro Computer’s returns actually do not cover its own cost of equity, with a discrepancy of -1.92%. This isn’t sustainable as it implies, very simply, that the company pays more for its capital than what it generates in return. ROE can be dissected into three distinct ratios: net profit margin, asset turnover, and financial leverage. This is called the Dupont Formula:
Dupont Formula
ROE = profit margin × asset turnover × financial leverage
ROE = (annual net profit ÷ sales) × (sales ÷ assets) × (assets ÷ shareholders’ equity)
ROE = annual net profit ÷ shareholders’ equity
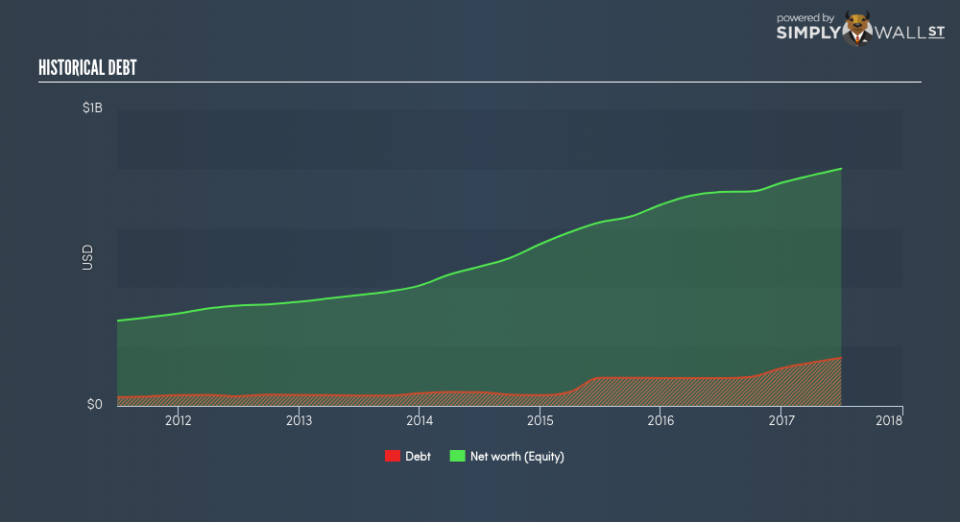
The first component is profit margin, which measures how much of sales is retained after the company pays for all its expenses. Asset turnover shows how much revenue Super Micro Computer can generate with its current asset base. The most interesting ratio, and reflective of sustainability of its ROE, is financial leverage. Since ROE can be artificially increased through excessive borrowing, we should check Super Micro Computer’s historic debt-to-equity ratio. Currently the debt-to-equity ratio stands at a low 20.18%, which means Super Micro Computer still has headroom to take on more leverage in order to increase profits.
Next Steps:
While ROE is a relatively simple calculation, it can be broken down into different ratios, each telling a different story about the strengths and weaknesses of a company. Super Micro Computer exhibits a weak ROE against its peers, as well as insufficient levels to cover its own cost of equity this year. However, ROE is not likely to be inflated by excessive debt funding, giving shareholders more conviction in the sustainability of returns, which has headroom to increase further. Although ROE can be a useful metric, it is only a small part of diligent research.
For Super Micro Computer, I’ve compiled three essential aspects you should further research:
Financial Health: Does it have a healthy balance sheet? Take a look at our free balance sheet analysis with six simple checks on key factors like leverage and risk.
Valuation: What is Super Micro Computer worth today? Is the stock undervalued, even when its growth outlook is factored into its intrinsic value? The intrinsic value infographic in our free research report helps visualize whether Super Micro Computer is currently mispriced by the market.
Other High-Growth Alternatives : Are there other high-growth stocks you could be holding instead of Super Micro Computer? Explore our interactive list of stocks with large growth potential to get an idea of what else is out there you may be missing!
To help readers see pass the short term volatility of the financial market, we aim to bring you a long-term focused research analysis purely driven by fundamental data. Note that our analysis does not factor in the latest price sensitive company announcements.
The author is an independent contributor and at the time of publication had no position in the stocks mentioned.
