Why Vermilion Energy Inc's Stock Skyrocketed 11% in a Quarter: A Deep Dive
Vermilion Energy Inc (NYSE:VET), an international oil and gas-producing company, has seen a significant surge in its stock price over the past quarter. With a current market cap of $2.32 billion and a price of $14.2, the company's stock has gained 3.12% over the past week and 10.62% over the past three months. This article aims to provide an in-depth analysis of Vermilion Energy's stock performance, profitability, growth, and competition.
Stock Performance Analysis
Over the past three months, Vermilion Energy's stock has seen a substantial gain of 10.62%. The company's GF Value, a measure of a stock's intrinsic value defined by GuruFocus.com, currently stands at $13.06, down from $15.12 three months ago. Despite this decrease, the stock's GF Valuation has improved from 'Modestly Undervalued' to 'Fairly Valued', indicating a positive market sentiment towards the company's stock.
Introduction to Vermilion Energy Inc
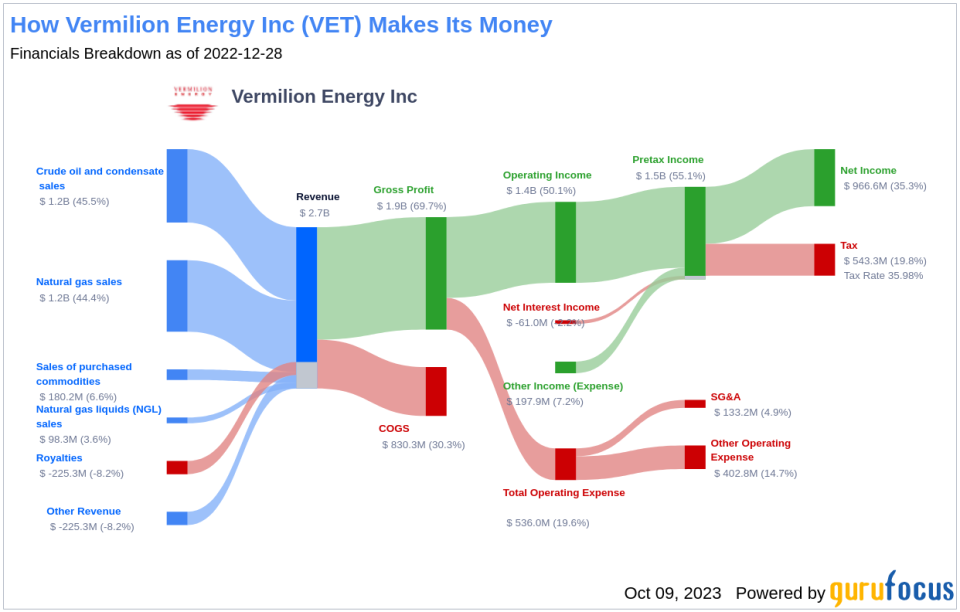
Vermilion Energy Inc is a prominent player in the oil and gas industry. The company engages in full-cycle exploration and production programs, focusing on the acquisition, exploration, development, and optimization of producing properties in North America, Europe, and Australia. The majority of Vermilion's revenue is derived from the production and sale of petroleum and natural gas, primarily in Canada.
Profitability Analysis
Vermilion Energy boasts a high Profitability Rank of 7/10, indicating a strong level of profitability. The company's Operating Margin of 38.06% is better than 81.67% of 982 companies in the same industry. Furthermore, Vermilion's ROE, ROA, and ROIC, which measure the company's profitability in relation to its equity, assets, and invested capital respectively, are all higher than the industry average. Over the past 10 years, the company has maintained profitability for 7 years, outperforming 68.21% of 953 companies.
Growth Analysis
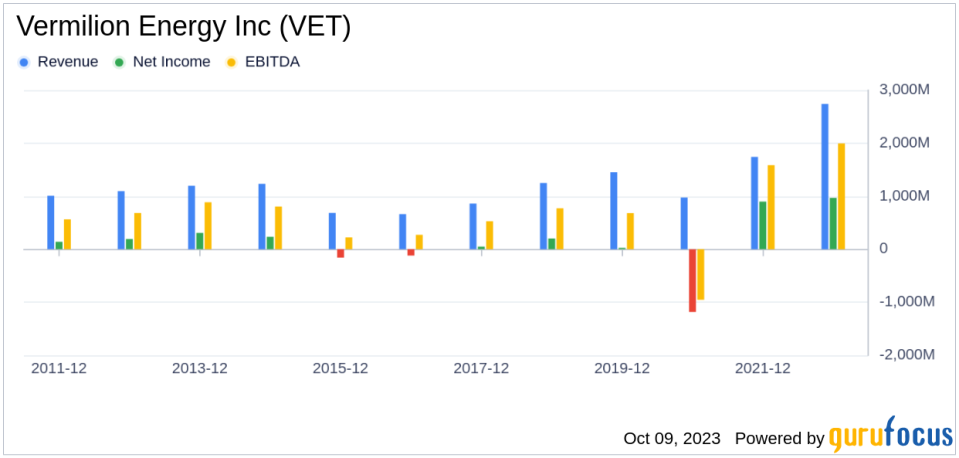
Vermilion Energy's Growth Rank stands at 5/10, indicating moderate growth. The company's 3-year and 5-year revenue growth rates per share are better than 72.49% and 73.57% of companies in the same industry, respectively. Moreover, Vermilion's 3-year EPS without NRI growth rate is better than 98.12% of 692 companies, demonstrating a strong growth trajectory.
Major Stock Holders
The top three holders of Vermilion Energy Inc's stock are Jeremy Grantham (Trades, Portfolio), Steven Cohen (Trades, Portfolio), and Jim Simons (Trades, Portfolio). Grantham holds 946,555 shares, accounting for 0.58% of the total shares, while Cohen and Simons hold 779,500 and 519,661 shares, representing 0.48% and 0.32% of the total shares, respectively.
Competitor Analysis
Vermilion Energy Inc faces competition from several companies in the oil and gas industry. Its main competitors include NuVista Energy Ltd (TSX:NVA) with a market cap of $2.02 billion, Parex Resources Inc (TSX:PXT) with a market cap of $1.83 billion, and Freehold Royalties Ltd (TSX:FRU) with a market cap of $1.56 billion.
Conclusion
In conclusion, Vermilion Energy Inc's stock performance, profitability, and growth have been impressive over the past quarter. Despite facing stiff competition in the oil and gas industry, the company has managed to maintain a high level of profitability and growth. With a GF Valuation indicating that the stock is 'Fairly Valued', investors may want to keep a close eye on Vermilion Energy Inc.
This article, generated by GuruFocus, is designed to provide general insights and is not tailored financial advice. Our commentary is rooted in historical data and analyst projections, utilizing an impartial methodology, and is not intended to serve as specific investment guidance. It does not formulate a recommendation to purchase or divest any stock and does not consider individual investment objectives or financial circumstances. Our objective is to deliver long-term, fundamental data-driven analysis. Be aware that our analysis might not incorporate the most recent, price-sensitive company announcements or qualitative information. GuruFocus holds no position in the stocks mentioned herein.
This article first appeared on GuruFocus.
