Winnebago Industries Inc (WGO): A Deep Dive into Financial Metrics and Competitive Strengths
Winnebago Industries Inc (NYSE:WGO) has recently been in the spotlight, drawing interest from investors and financial analysts due to its robust financial stance. With shares currently priced at $59.57, Winnebago Industries Inc has witnessed a daily loss of 3.25%, marked against a three-month change of -3.76%. A thorough analysis, underlined by the GF Score, suggests that Winnebago Industries Inc is well-positioned for substantial growth in the near future.
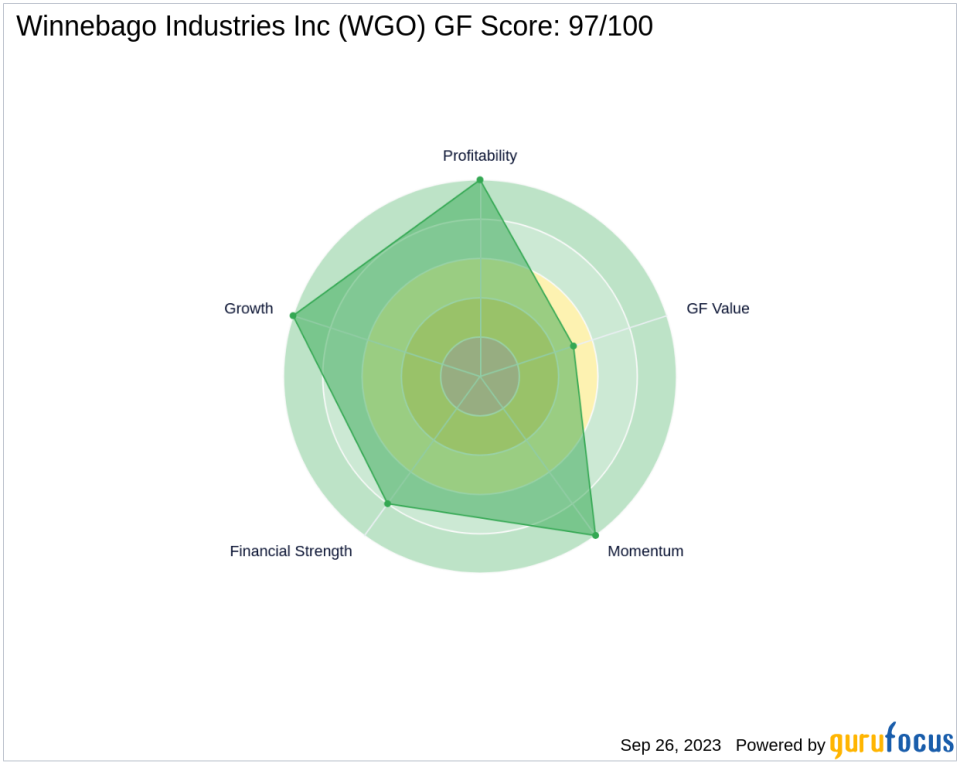
Understanding the GF Score
The GF Score is a stock performance ranking system developed by GuruFocus using five aspects of valuation, which has been found to be closely correlated to the long-term performances of stocks by backtesting from 2006 to 2021. The stocks with a higher GF Score generally generate higher returns than those with a lower GF Score. Therefore, when picking stocks, investors should invest in companies with high GF Scores. The GF Score ranges from 0 to 100, with 100 as the highest rank.
Winnebago Industries Inc has been assigned the following ranks:
Financial strength rank: 8/10
Profitability rank: 10/10
Growth rank: 10/10
GF Value rank: 5/10
Momentum rank: 10/10
Each one of these components is ranked and the ranks also have positive correlation with the long term performances of stocks. The GF score is calculated using the five key aspects of analysis. Through backtesting, we know that each of these key aspects has a different impact on the stock price performance. Thus, they are weighted differently when calculating the total score. With high ranks in financial strength, profitability, growth, and momentum, and a moderate GF Value rank, GuruFocus assigned Winnebago Industries Inc the GF Score of 97 out of 100, which signals the highest outperformance potential.
Winnebago Industries Inc: A Snapshot
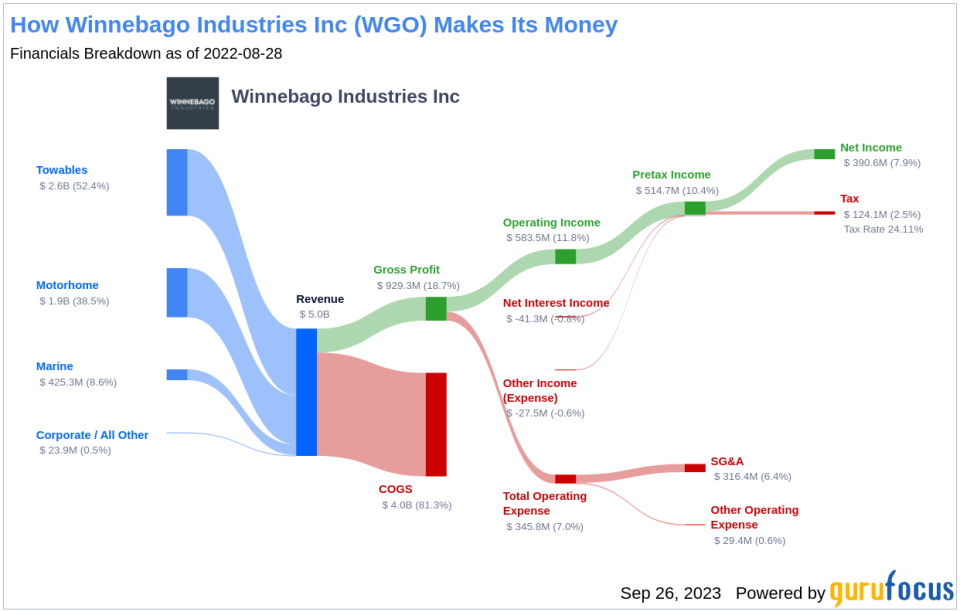
Winnebago Industries Inc, with a market cap of $1.8 billion and sales of $3.9 billion, is a leading manufacturer of Class A, B, and C motor homes along with towables, customized specialty vehicles, boats, and parts. Headquartered in Eden Prairie, Minnesota, Winnebago has been producing recreational vehicles since 1958. The company expanded into towables in 2011 with the acquisition of SunnyBrook and acquired Grand Design in November 2016. In fiscal 2022, towables made up 83% of the firm's RV unit volume, up from 31% in fiscal 2016. The company's total RV unit volume was 71,922 in fiscal 2022. Winnebago expanded into boating in 2018 with the purchase of Chris-Craft, bought premium motor home maker Newmar in November 2019, and bought Barletta pontoon boats in August 2021. It also is developing electric and autonomous technology.
Financial Strength Analysis
According to the Financial Strength rating, Winnebago Industries Inc's robust balance sheet exhibits resilience against financial volatility, reflecting prudent management of capital structure. The Interest Coverage ratio for Winnebago Industries Inc stands impressively at 13.79, underscoring its strong capability to cover its interest obligations. With a favorable Debt-to-Revenue ratio of 0.16, Winnebago Industries Inc's strategic handling of debt solidifies its financial health.
Profitability Rank Breakdown
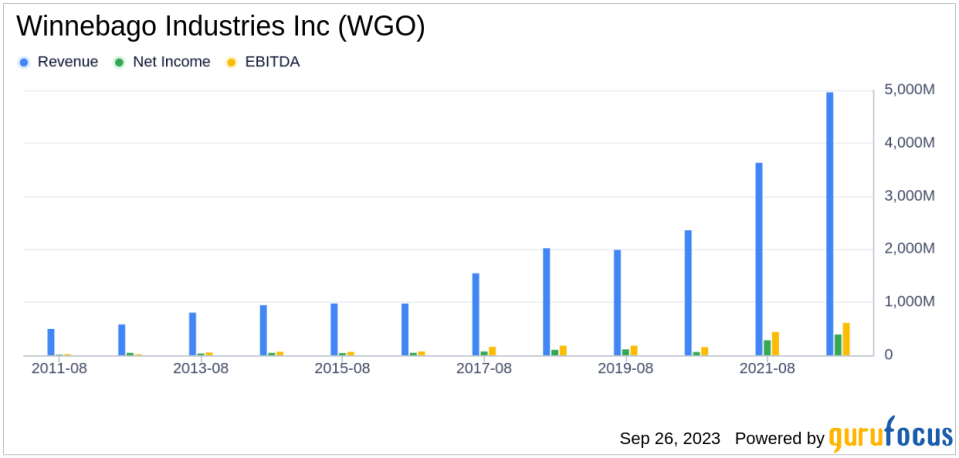
The Profitability Rank shows Winnebago Industries Inc's impressive standing among its peers in generating profit. Winnebago Industries Inc Operating Margin has increased (104.00%) over the past five years, as shown by the following data: 2019: 7.82; 2020: 4.83; 2021: 11.22; 2022: 11.77; 2023: 16.22. Furthermore, Winnebago Industries Inc's Gross Margin has seen a consistent rise over the past five years, as evidenced by the data: 2019: 15.47; 2020: 13.28; 2021: 17.92; 2022: 18.75; 2023: 25.84. This trend underscores the company's growing proficiency in transforming revenue into profit. Winnebago Industries Inc's strong Predictability Rank of 4.5 stars out of five underscores its consistent operational performance, providing investors with increased confidence.
Growth Rank Breakdown
Ranked highly in Growth, Winnebago Industries Inc demonstrates a strong commitment to expanding its business. The company's 3-Year Revenue Growth Rate is 33.9%, which outperforms better than 92.87% of 1206 companies in the Vehicles & Parts industry. Moreover, Winnebago Industries Inc has seen a robust increase in its earnings before interest, taxes, depreciation, and amortization (EBITDA) over the past few years. Specifically, the three-year growth rate stands at 48.2, and the rate over the past five years is 28.2. This trend accentuates the company's continued capability to drive growth.
Conclusion
With its strong financial strength, profitability, and growth metrics, the GF Score highlights Winnebago Industries Inc's unparalleled position for potential outperformance. This analysis underscores the company's robust financial health, consistent profitability, and impressive growth, making it a compelling investment opportunity. GuruFocus Premium members can find more companies with strong GF Scores using the following screener link: GF Score Screen
This article first appeared on GuruFocus.
