Winnebago Industries Inc's Dividend Analysis: A Deep Dive into Its Performance and Sustainability
A comprehensive review of Winnebago Industries Inc's dividend history, yield, growth rate, and the factors influencing its future prospects
Winnebago Industries Inc (NYSE:WGO) recently announced a dividend of $0.31 per share, payable on 2023-09-27, with the ex-dividend date set for 2023-09-12. As investors look forward to this upcoming payment, the spotlight also shines on the company's dividend history, yield, and growth rates. Using the data from GuruFocus, let's deep dive into Winnebago Industries Inc's dividend performance and assess its sustainability.
Introduction to Winnebago Industries Inc
Warning! GuruFocus has detected 3 Warning Sign with WGO. Click here to check it out.
This Powerful Chart Made Peter Lynch 29% A Year For 13 Years
How to calculate the intrinsic value of a stock?
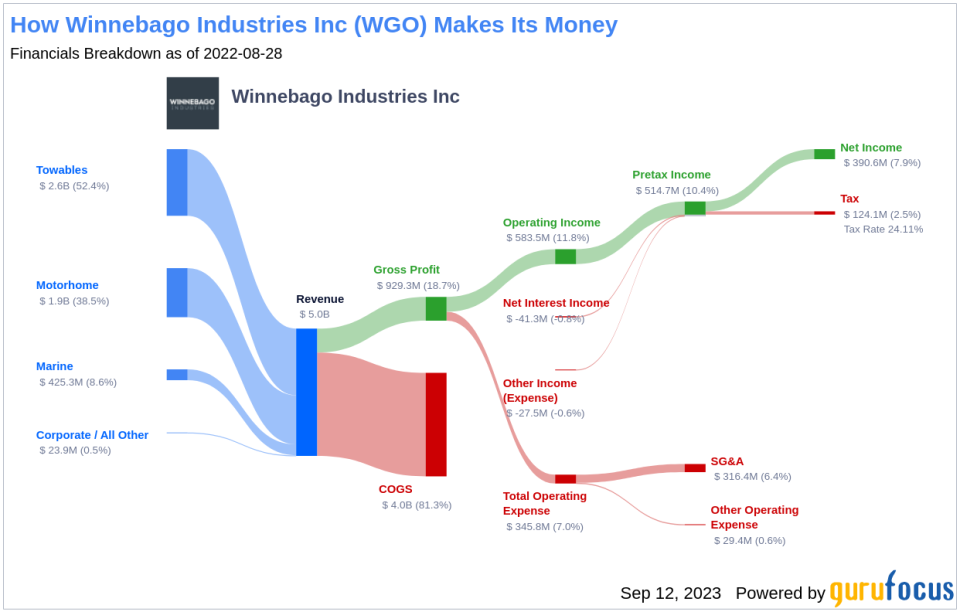
Winnebago Industries manufactures Class A, B, and C motor homes along with towables, customized specialty vehicles, boats, and parts. Headquartered in Eden Prairie, Minnesota, Winnebago has been producing recreational vehicles since 1958. Revenue was about $5 billion in fiscal 2022. Winnebago expanded into towables in 2011 with the acquisition of SunnyBrook and acquired Grand Design in November 2016. Towables made up 83% of the firm's RV unit volume, up from 31% in fiscal 2016. The company's total RV unit volume was 71,922 in fiscal 2022. Winnebago expanded into boating in 2018 with the purchase of Chris-Craft, bought premium motor home maker Newmar in November 2019, and bought Barletta pontoon boats in August 2021. It also is developing electric and autonomous technology.
Winnebago Industries Inc's Dividend History
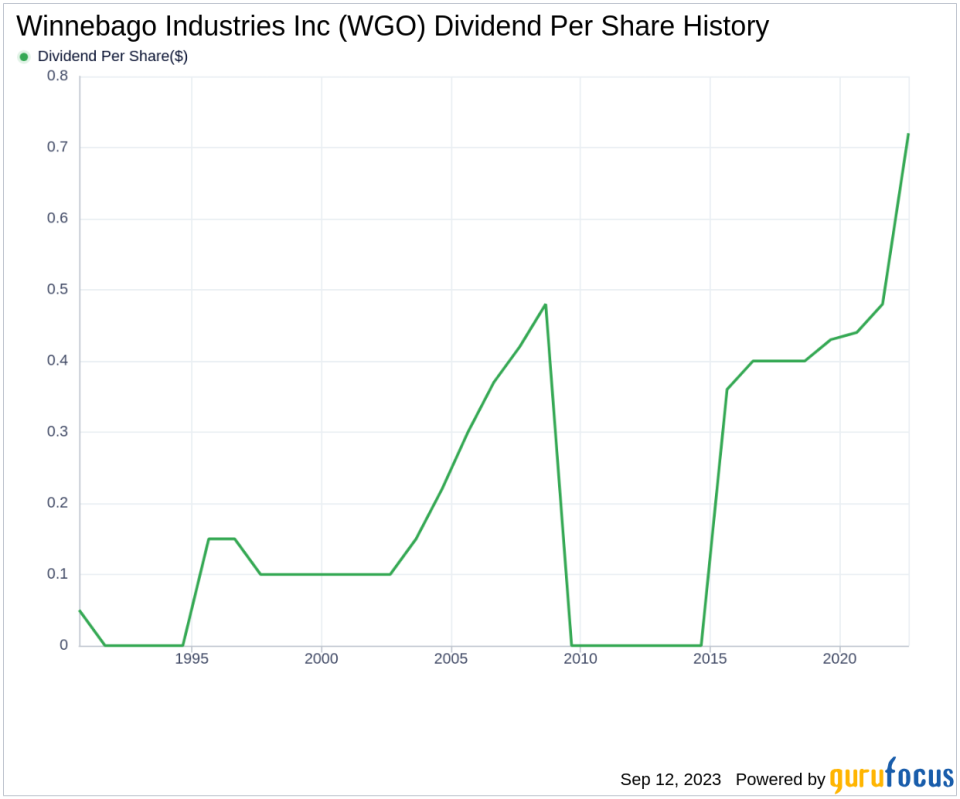
Winnebago Industries Inc has maintained a consistent dividend payment record since 2014. Dividends are currently distributed on a quarterly basis. Below is a chart showing annual Dividends Per Share for tracking historical trends.
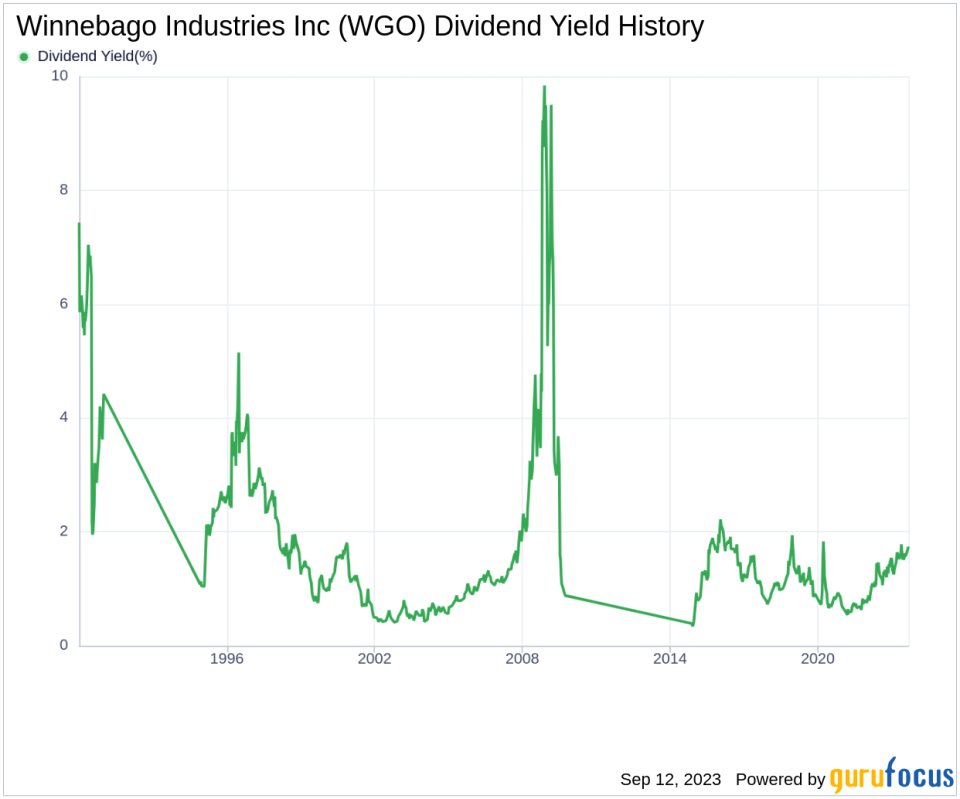
Winnebago Industries Inc's Dividend Yield and Growth
As of today, Winnebago Industries Inc currently has a 12-month trailing dividend yield of 1.78% and a 12-month forward dividend yield of 2.04%. This suggests an expectation of increased dividend payments over the next 12 months.
Over the past three years, Winnebago Industries Inc's annual dividend growth rate was 18.70%. Extended to a five-year horizon, this rate decreased to 10.60% per year. Based on Winnebago Industries Inc's dividend yield and five-year growth rate, the 5-year yield on cost of Winnebago Industries Inc stock as of today is approximately 2.95%.
The Sustainability of Winnebago Industries Inc's Dividend
To assess the sustainability of the dividend, one needs to evaluate the company's payout ratio. The dividend payout ratio provides insights into the portion of earnings the company distributes as dividends. A lower ratio suggests that the company retains a significant part of its earnings, thereby ensuring the availability of funds for future growth and unexpected downturns. As of 2023-05-31, Winnebago Industries Inc's dividend payout ratio is 0.13.
Winnebago Industries Inc's profitability rank, offers an understanding of the company's earnings prowess relative to its peers. GuruFocus ranks Winnebago Industries Inc's profitability 10 out of 10 as of 2023-05-31, suggesting good profitability prospects. The company has reported positive net income for each of year over the past decade, further solidifying its high profitability.
Winnebago Industries Inc's Growth Metrics
To ensure the sustainability of dividends, a company must have robust growth metrics. Winnebago Industries Inc's growth rank of 10 out of 10 suggests that the company's growth trajectory is good relative to its competitors.
Revenue is the lifeblood of any company, and Winnebago Industries Inc's revenue per share, combined with the 3-year revenue growth rate, indicates a strong revenue model. Winnebago Industries Inc's revenue has increased by approximately 33.90% per year on average, a rate that outperforms approximately 92.98% of global competitors.
The company's 3-year EPS growth rate showcases its capability to grow its earnings, a critical component for sustaining dividends in the long run. During the past three years, Winnebago Industries Inc's earnings increased by approximately 49.80% per year on average, a rate that outperforms approximately 84.67% of global competitors.
Lastly, the company's 5-year EBITDA growth rate of 34.40%, outperforms approximately 90.46% of global competitors.
Conclusion
In conclusion, Winnebago Industries Inc's consistent dividend payments, impressive dividend growth rate, low payout ratio, high profitability, and robust growth metrics suggest a bright future for its dividends. However, investors should continue to monitor these factors to ensure the company's dividend sustainability. GuruFocus Premium users can screen for high-dividend yield stocks using the High Dividend Yield Screener.
This article first appeared on GuruFocus.
