Winnebago Industries (WGO): A Comprehensive Analysis of its Fair Market Value
With a daily price decrease of 3.25%, a 3-month loss of 3.76%, and an Earnings Per Share (EPS) of 7.57, Winnebago Industries Inc (NYSE:WGO) sparks curiosity among investors. Is the stock fairly valued? This article provides an in-depth analysis to answer this question. Let's delve into the valuation analysis of Winnebago Industries.
Introduction to Winnebago Industries
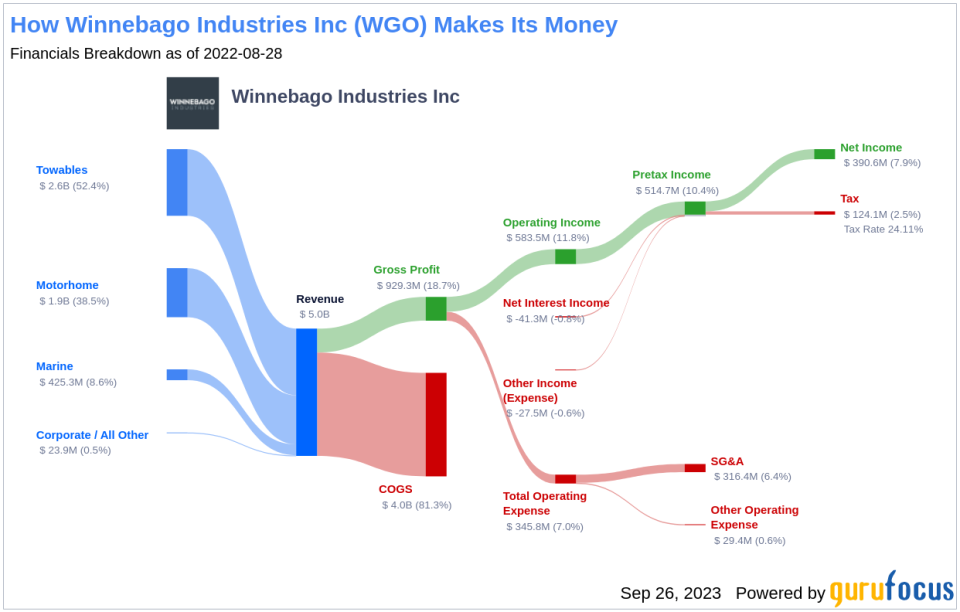
Winnebago Industries Inc, a renowned manufacturer of Class A, B, and C motor homes, towables, customized specialty vehicles, boats, and parts, has been a key player in the recreational vehicle industry since 1958. Based in Eden Prairie, Minnesota, Winnebago Industries has expanded its operations over the years, generating a revenue of about $5 billion in fiscal 2022. The company's current stock price stands at $59.57, with a GF Value of $64.41, indicating a fair valuation. This sets the stage for a more profound exploration of the company's value.
Understanding the GF Value
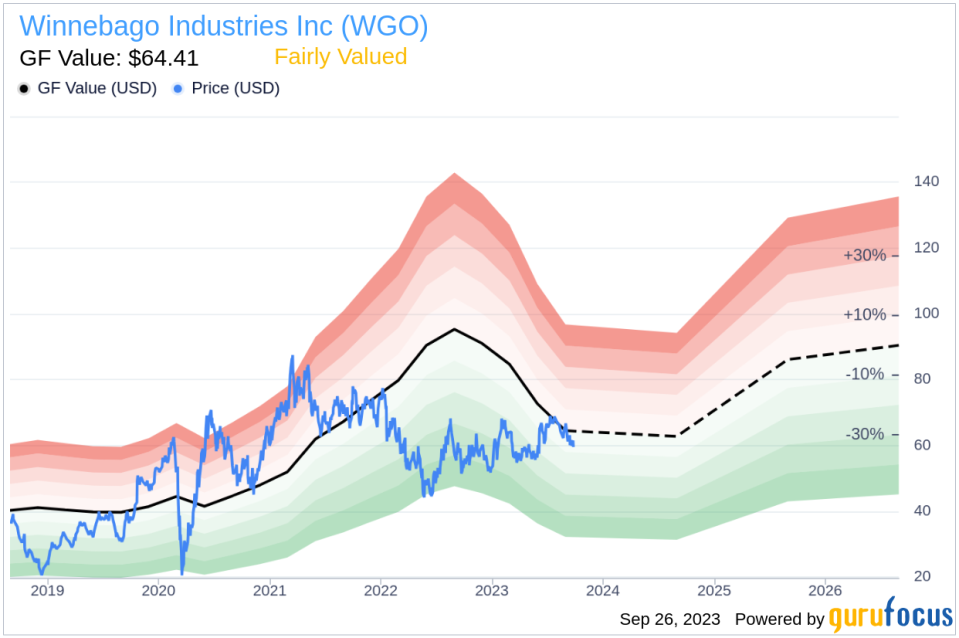
The GF Value is a unique measure of a stock's intrinsic value, calculated based on historical trading multiples, a GuruFocus adjustment factor, and future business performance estimates. The GF Value Line represents the fair value at which the stock should ideally be traded. If the stock price significantly deviates from the GF Value Line, it indicates overvaluation or undervaluation, potentially affecting future returns.
For Winnebago Industries, the current price of $59.57 per share and a market cap of $1.80 billion suggests that the stock is fairly valued. Therefore, the long-term return of its stock is likely to align with the rate of its business growth.
Financial Strength of Winnebago Industries
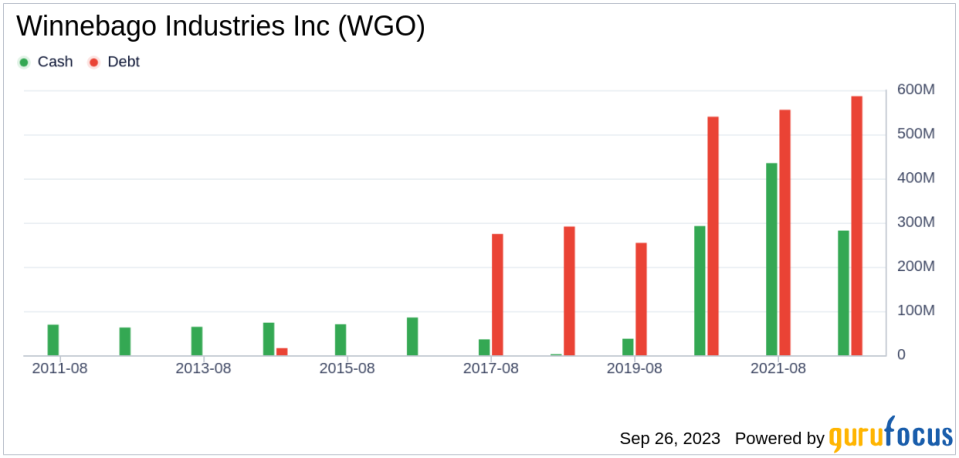
Investing in companies with poor financial strength can lead to a high risk of permanent capital loss. Therefore, it's crucial to understand a company's financial strength before investing. Winnebago Industries has a cash-to-debt ratio of 0.36, ranking below 62.11% of 1230 companies in the Vehicles & Parts industry. However, the overall financial strength of Winnebago Industries is 8 out of 10, indicating strong financial health.
Profitability and Growth of Winnebago Industries
Investing in profitable companies is less risky, especially if they have demonstrated consistent profitability over the long term. Winnebago Industries has been profitable for 10 out of the past 10 years. Over the past 12 months, the company generated revenues of $3.90 billion and an Earnings Per Share (EPS) of $7.57. With an operating margin of 9.41%, it outperforms 75.81% of 1265 companies in the Vehicles & Parts industry.
Furthermore, growth is a crucial factor in a company's valuation. Winnebago Industries has an average annual revenue growth of 33.9%, ranking better than 92.87% of 1206 companies in the Vehicles & Parts industry. The 3-year average EBITDA growth is 48.2%, which ranks better than 90.36% of 1079 companies in the same industry.
ROIC vs WACC
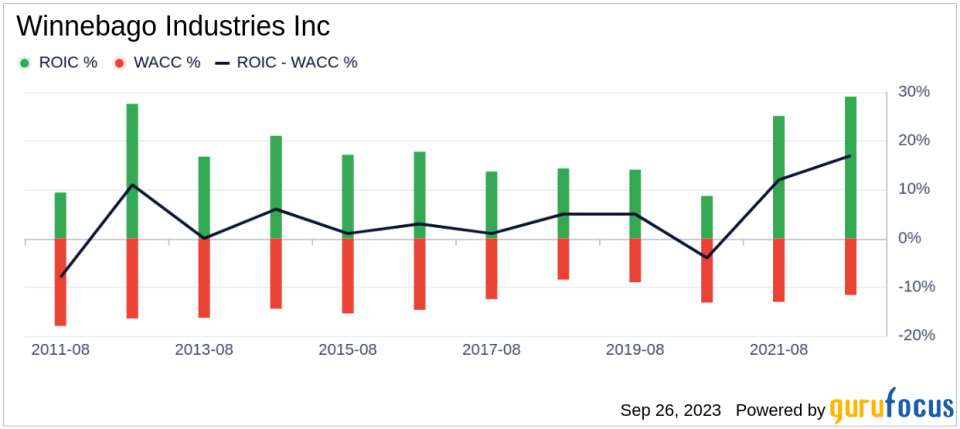
Return on invested capital (ROIC) and weighted average cost of capital (WACC) are key indicators of a company's profitability. For the past 12 months, Winnebago Industries's ROIC is 15.41, and its WACC is 9.35, indicating a healthy profitability.
Conclusion
In summary, Winnebago Industries (NYSE:WGO) appears to be fairly valued. The company's strong financial condition, consistent profitability, and impressive growth rank it among the top performers in the Vehicles & Parts industry. To learn more about Winnebago Industries stock, check out its 30-Year Financials here.
For high-quality companies likely to deliver above-average returns, check out GuruFocus High Quality Low Capex Screener.
This article first appeared on GuruFocus.
