Woodward, Inc. (NASDAQ:WWD) is a favorite amongst institutional investors who own 82%
Key Insights
Given the large stake in the stock by institutions, Woodward's stock price might be vulnerable to their trading decisions
51% of the business is held by the top 10 shareholders
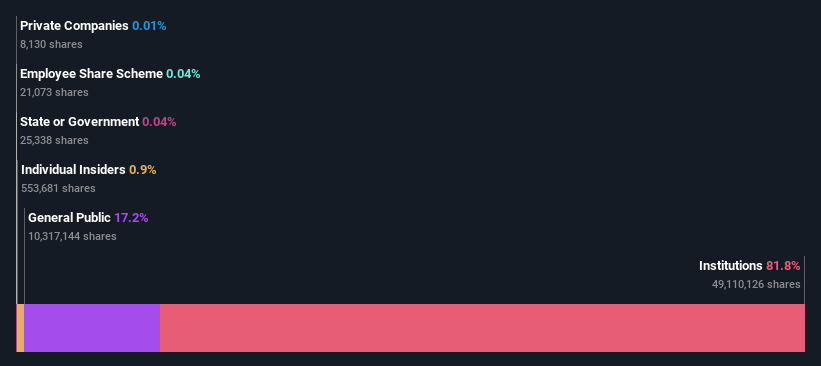
If you want to know who really controls Woodward, Inc. (NASDAQ:WWD), then you'll have to look at the makeup of its share registry. With 82% stake, institutions possess the maximum shares in the company. In other words, the group stands to gain the most (or lose the most) from their investment into the company.
Given the vast amount of money and research capacities at their disposal, institutional ownership tends to carry a lot of weight, especially with individual investors. Hence, having a considerable amount of institutional money invested in a company is often regarded as a desirable trait.
Let's delve deeper into each type of owner of Woodward, beginning with the chart below.
Check out our latest analysis for Woodward
What Does The Institutional Ownership Tell Us About Woodward?
Many institutions measure their performance against an index that approximates the local market. So they usually pay more attention to companies that are included in major indices.
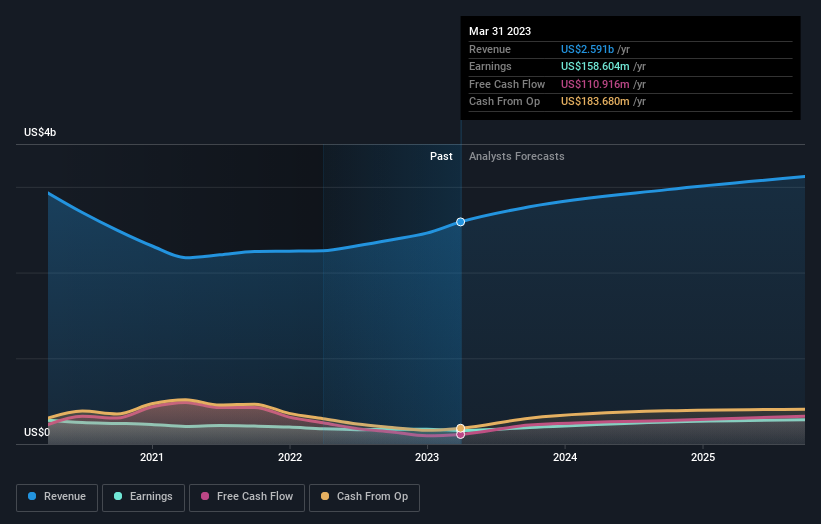
As you can see, institutional investors have a fair amount of stake in Woodward. This implies the analysts working for those institutions have looked at the stock and they like it. But just like anyone else, they could be wrong. If multiple institutions change their view on a stock at the same time, you could see the share price drop fast. It's therefore worth looking at Woodward's earnings history below. Of course, the future is what really matters.
Since institutional investors own more than half the issued stock, the board will likely have to pay attention to their preferences. Woodward is not owned by hedge funds. The company's largest shareholder is Capital Research and Management Company, with ownership of 12%. For context, the second largest shareholder holds about 10% of the shares outstanding, followed by an ownership of 9.4% by the third-largest shareholder.
On further inspection, we found that more than half the company's shares are owned by the top 10 shareholders, suggesting that the interests of the larger shareholders are balanced out to an extent by the smaller ones.
Researching institutional ownership is a good way to gauge and filter a stock's expected performance. The same can be achieved by studying analyst sentiments. Quite a few analysts cover the stock, so you could look into forecast growth quite easily.
Insider Ownership Of Woodward
The definition of an insider can differ slightly between different countries, but members of the board of directors always count. Management ultimately answers to the board. However, it is not uncommon for managers to be executive board members, especially if they are a founder or the CEO.
Most consider insider ownership a positive because it can indicate the board is well aligned with other shareholders. However, on some occasions too much power is concentrated within this group.
Our information suggests that Woodward, Inc. insiders own under 1% of the company. It's a big company, so even a small proportional interest can create alignment between the board and shareholders. In this case insiders own US$66m worth of shares. It is good to see board members owning shares, but it might be worth checking if those insiders have been buying.
General Public Ownership
With a 17% ownership, the general public, mostly comprising of individual investors, have some degree of sway over Woodward. This size of ownership, while considerable, may not be enough to change company policy if the decision is not in sync with other large shareholders.
Next Steps:
I find it very interesting to look at who exactly owns a company. But to truly gain insight, we need to consider other information, too.
I like to dive deeper into how a company has performed in the past. You can find historic revenue and earnings in this detailed graph.
If you are like me, you may want to think about whether this company will grow or shrink. Luckily, you can check this free report showing analyst forecasts for its future.
NB: Figures in this article are calculated using data from the last twelve months, which refer to the 12-month period ending on the last date of the month the financial statement is dated. This may not be consistent with full year annual report figures.
Have feedback on this article? Concerned about the content? Get in touch with us directly. Alternatively, email editorial-team (at) simplywallst.com.
This article by Simply Wall St is general in nature. We provide commentary based on historical data and analyst forecasts only using an unbiased methodology and our articles are not intended to be financial advice. It does not constitute a recommendation to buy or sell any stock, and does not take account of your objectives, or your financial situation. We aim to bring you long-term focused analysis driven by fundamental data. Note that our analysis may not factor in the latest price-sensitive company announcements or qualitative material. Simply Wall St has no position in any stocks mentioned.
Join A Paid User Research Session
You’ll receive a US$30 Amazon Gift card for 1 hour of your time while helping us build better investing tools for the individual investors like yourself. Sign up here
