Should We Worry About American Vanguard Corporation's (NYSE:AVD) P/E Ratio?

Today, we'll introduce the concept of the P/E ratio for those who are learning about investing. We'll look at American Vanguard Corporation's (NYSE:AVD) P/E ratio and reflect on what it tells us about the company's share price. What is American Vanguard's P/E ratio? Well, based on the last twelve months it is 26.42. That means that at current prices, buyers pay $26.42 for every $1 in trailing yearly profits.
View our latest analysis for American Vanguard
How Do I Calculate A Price To Earnings Ratio?
The formula for price to earnings is:
Price to Earnings Ratio = Share Price ÷ Earnings per Share (EPS)
Or for American Vanguard:
P/E of 26.42 = $15.97 ÷ $0.60 (Based on the year to September 2019.)
Is A High Price-to-Earnings Ratio Good?
A higher P/E ratio means that investors are paying a higher price for each $1 of company earnings. That isn't a good or a bad thing on its own, but a high P/E means that buyers have a higher opinion of the business's prospects, relative to stocks with a lower P/E.
Does American Vanguard Have A Relatively High Or Low P/E For Its Industry?
The P/E ratio indicates whether the market has higher or lower expectations of a company. The image below shows that American Vanguard has a higher P/E than the average (20.2) P/E for companies in the chemicals industry.
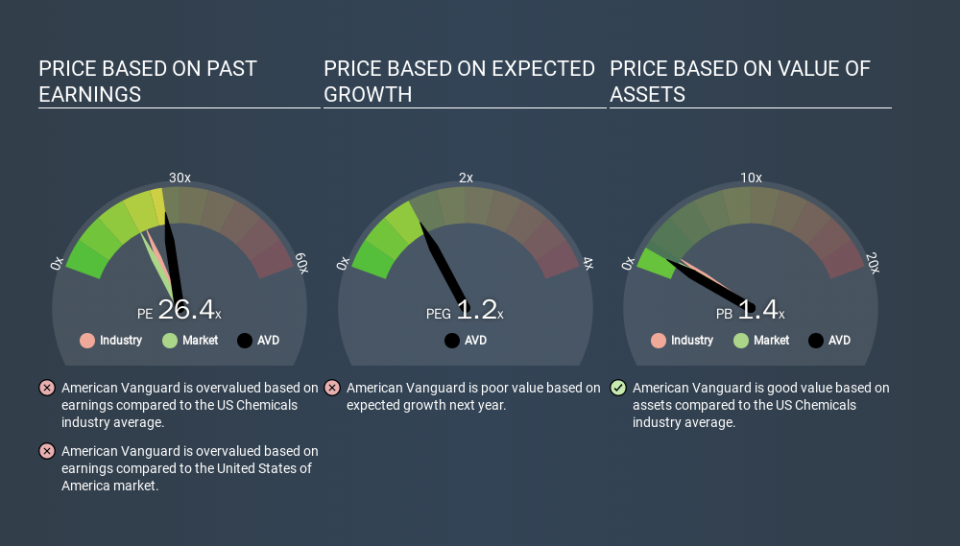
Its relatively high P/E ratio indicates that American Vanguard shareholders think it will perform better than other companies in its industry classification. Shareholders are clearly optimistic, but the future is always uncertain. So investors should delve deeper. I like to check if company insiders have been buying or selling.
How Growth Rates Impact P/E Ratios
Probably the most important factor in determining what P/E a company trades on is the earnings growth. That's because companies that grow earnings per share quickly will rapidly increase the 'E' in the equation. And in that case, the P/E ratio itself will drop rather quickly. A lower P/E should indicate the stock is cheap relative to others -- and that may attract buyers.
American Vanguard shrunk earnings per share by 30% over the last year. But it has grown its earnings per share by 39% per year over the last five years.
Don't Forget: The P/E Does Not Account For Debt or Bank Deposits
It's important to note that the P/E ratio considers the market capitalization, not the enterprise value. That means it doesn't take debt or cash into account. In theory, a company can lower its future P/E ratio by using cash or debt to invest in growth.
Such spending might be good or bad, overall, but the key point here is that you need to look at debt to understand the P/E ratio in context.
So What Does American Vanguard's Balance Sheet Tell Us?
American Vanguard's net debt equates to 33% of its market capitalization. While it's worth keeping this in mind, it isn't a worry.
The Verdict On American Vanguard's P/E Ratio
American Vanguard's P/E is 26.4 which is above average (18.3) in its market. With modest debt but no EPS growth in the last year, it's fair to say the P/E implies some optimism about future earnings, from the market.
When the market is wrong about a stock, it gives savvy investors an opportunity. People often underestimate remarkable growth -- so investors can make money when fast growth is not fully appreciated. So this free visual report on analyst forecasts could hold the key to an excellent investment decision.
But note: American Vanguard may not be the best stock to buy. So take a peek at this free list of interesting companies with strong recent earnings growth (and a P/E ratio below 20).
If you spot an error that warrants correction, please contact the editor at editorial-team@simplywallst.com. This article by Simply Wall St is general in nature. It does not constitute a recommendation to buy or sell any stock, and does not take account of your objectives, or your financial situation. Simply Wall St has no position in the stocks mentioned.
We aim to bring you long-term focused research analysis driven by fundamental data. Note that our analysis may not factor in the latest price-sensitive company announcements or qualitative material. Thank you for reading.
