Should We Worry About CMS Energy Corporation’s (NYSE:CMS) P/E Ratio?

Want to participate in a short research study? Help shape the future of investing tools and you could win a $250 gift card!
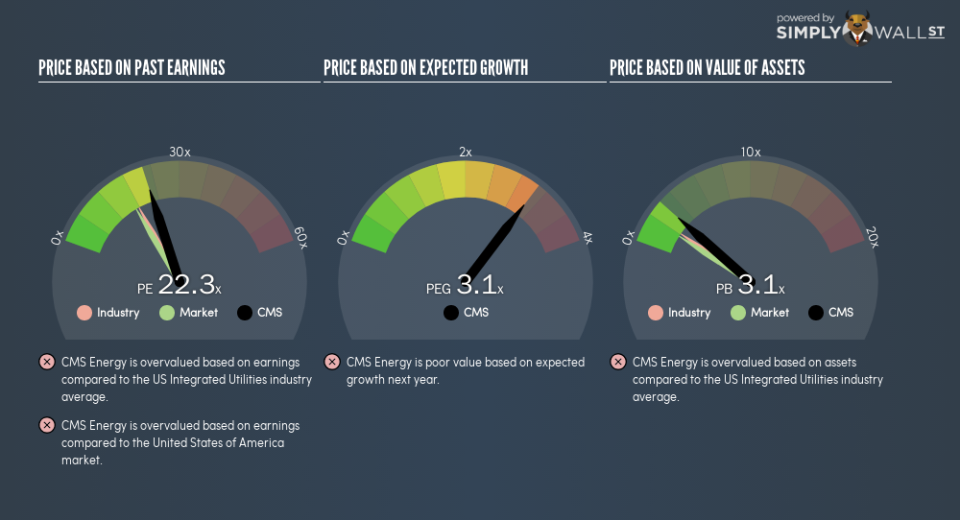
The goal of this article is to teach you how to use price to earnings ratios (P/E ratios). We’ll show how you can use CMS Energy Corporation’s (NYSE:CMS) P/E ratio to inform your assessment of the investment opportunity. CMS Energy has a price to earnings ratio of 22.33, based on the last twelve months. That is equivalent to an earnings yield of about 4.5%.
See our latest analysis for CMS Energy
How Do I Calculate CMS Energy’s Price To Earnings Ratio?
The formula for P/E is:
Price to Earnings Ratio = Share Price ÷ Earnings per Share (EPS)
Or for CMS Energy:
P/E of 22.33 = $51.98 ÷ $2.33 (Based on the year to December 2018.)
Is A High Price-to-Earnings Ratio Good?
A higher P/E ratio implies that investors pay a higher price for the earning power of the business. That isn’t necessarily good or bad, but a high P/E implies relatively high expectations of what a company can achieve in the future.
How Growth Rates Impact P/E Ratios
Earnings growth rates have a big influence on P/E ratios. Earnings growth means that in the future the ‘E’ will be higher. Therefore, even if you pay a high multiple of earnings now, that multiple will become lower in the future. Then, a lower P/E should attract more buyers, pushing the share price up.
Notably, CMS Energy grew EPS by a whopping 42% in the last year. And its annual EPS growth rate over 5 years is 2.5%. So we’d generally expect it to have a relatively high P/E ratio.
How Does CMS Energy’s P/E Ratio Compare To Its Peers?
The P/E ratio essentially measures market expectations of a company. As you can see below, CMS Energy has a higher P/E than the average company (18.1) in the integrated utilities industry.
Its relatively high P/E ratio indicates that CMS Energy shareholders think it will perform better than other companies in its industry classification. Shareholders are clearly optimistic, but the future is always uncertain. So investors should delve deeper. I like to check if company insiders have been buying or selling.
A Limitation: P/E Ratios Ignore Debt and Cash In The Bank
Don’t forget that the P/E ratio considers market capitalization. That means it doesn’t take debt or cash into account. Hypothetically, a company could reduce its future P/E ratio by spending its cash (or taking on debt) to achieve higher earnings.
Spending on growth might be good or bad a few years later, but the point is that the P/E ratio does not account for the option (or lack thereof).
How Does CMS Energy’s Debt Impact Its P/E Ratio?
CMS Energy’s net debt is 79% of its market cap. This is a reasonably significant level of debt — all else being equal you’d expect a much lower P/E than if it had net cash.
The Bottom Line On CMS Energy’s P/E Ratio
CMS Energy’s P/E is 22.3 which is above average (16.8) in the US market. It’s good to see the recent earnings growth, although we note the company uses debt already. It seems the market believes growth will continue, judging by the P/E ratio.
When the market is wrong about a stock, it gives savvy investors an opportunity. As value investor Benjamin Graham famously said, ‘In the short run, the market is a voting machine but in the long run, it is a weighing machine.’ So this free visualization of the analyst consensus on future earnings could help you make the right decision about whether to buy, sell, or hold.
You might be able to find a better buy than CMS Energy. If you want a selection of possible winners, check out this free list of interesting companies that trade on a P/E below 20 (but have proven they can grow earnings).
To help readers see past the short term volatility of the financial market, we aim to bring you a long-term focused research analysis purely driven by fundamental data. Note that our analysis does not factor in the latest price-sensitive company announcements.
The author is an independent contributor and at the time of publication had no position in the stocks mentioned. For errors that warrant correction please contact the editor at editorial-team@simplywallst.com.
