Should We Worry About Hyster-Yale Materials Handling, Inc.'s (NYSE:HY) P/E Ratio?

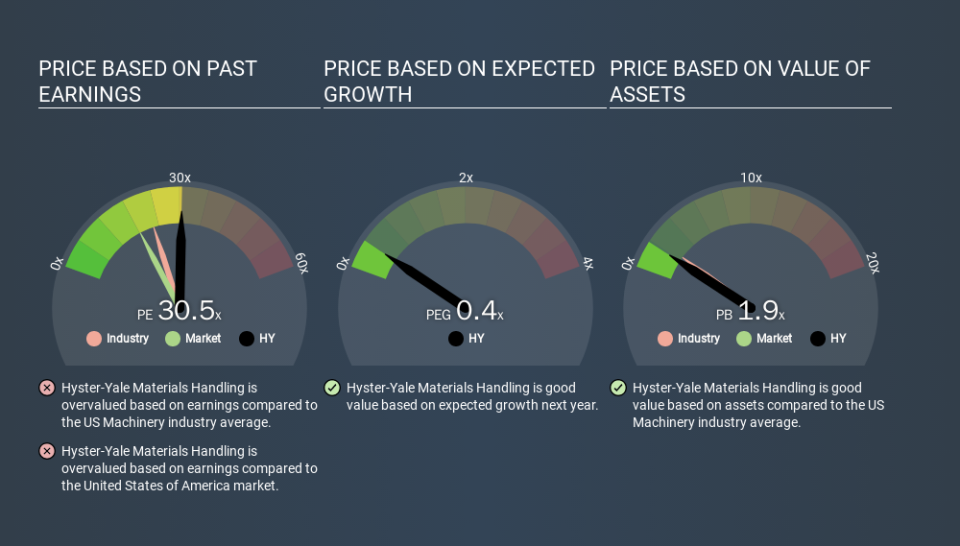
This article is for investors who would like to improve their understanding of price to earnings ratios (P/E ratios). We'll show how you can use Hyster-Yale Materials Handling, Inc.'s (NYSE:HY) P/E ratio to inform your assessment of the investment opportunity. Hyster-Yale Materials Handling has a price to earnings ratio of 30.54, based on the last twelve months. In other words, at today's prices, investors are paying $30.54 for every $1 in prior year profit.
See our latest analysis for Hyster-Yale Materials Handling
How Do I Calculate A Price To Earnings Ratio?
The formula for P/E is:
Price to Earnings Ratio = Price per Share ÷ Earnings per Share (EPS)
Or for Hyster-Yale Materials Handling:
P/E of 30.54 = $57.34 ÷ $1.88 (Based on the year to September 2019.)
Is A High Price-to-Earnings Ratio Good?
The higher the P/E ratio, the higher the price tag of a business, relative to its trailing earnings. That isn't necessarily good or bad, but a high P/E implies relatively high expectations of what a company can achieve in the future.
Does Hyster-Yale Materials Handling Have A Relatively High Or Low P/E For Its Industry?
One good way to get a quick read on what market participants expect of a company is to look at its P/E ratio. As you can see below, Hyster-Yale Materials Handling has a higher P/E than the average company (22.0) in the machinery industry.
Its relatively high P/E ratio indicates that Hyster-Yale Materials Handling shareholders think it will perform better than other companies in its industry classification. The market is optimistic about the future, but that doesn't guarantee future growth. So investors should always consider the P/E ratio alongside other factors, such as whether company directors have been buying shares.
How Growth Rates Impact P/E Ratios
Companies that shrink earnings per share quickly will rapidly decrease the 'E' in the equation. Therefore, even if you pay a low multiple of earnings now, that multiple will become higher in the future. Then, a higher P/E might scare off shareholders, pushing the share price down.
Hyster-Yale Materials Handling's earnings per share fell by 7.4% in the last twelve months. And it has shrunk its earnings per share by 22% per year over the last five years. So it would be surprising to see a high P/E.
A Limitation: P/E Ratios Ignore Debt and Cash In The Bank
Don't forget that the P/E ratio considers market capitalization. In other words, it does not consider any debt or cash that the company may have on the balance sheet. In theory, a company can lower its future P/E ratio by using cash or debt to invest in growth.
While growth expenditure doesn't always pay off, the point is that it is a good option to have; but one that the P/E ratio ignores.
Is Debt Impacting Hyster-Yale Materials Handling's P/E?
Hyster-Yale Materials Handling's net debt equates to 28% of its market capitalization. While it's worth keeping this in mind, it isn't a worry.
The Verdict On Hyster-Yale Materials Handling's P/E Ratio
Hyster-Yale Materials Handling trades on a P/E ratio of 30.5, which is above its market average of 18.1. With some debt but no EPS growth last year, the market has high expectations of future profits.
When the market is wrong about a stock, it gives savvy investors an opportunity. If the reality for a company is better than it expects, you can make money by buying and holding for the long term. So this free report on the analyst consensus forecasts could help you make a master move on this stock.
You might be able to find a better buy than Hyster-Yale Materials Handling. If you want a selection of possible winners, check out this free list of interesting companies that trade on a P/E below 20 (but have proven they can grow earnings).
If you spot an error that warrants correction, please contact the editor at editorial-team@simplywallst.com. This article by Simply Wall St is general in nature. It does not constitute a recommendation to buy or sell any stock, and does not take account of your objectives, or your financial situation. Simply Wall St has no position in the stocks mentioned.
We aim to bring you long-term focused research analysis driven by fundamental data. Note that our analysis may not factor in the latest price-sensitive company announcements or qualitative material. Thank you for reading.
