Should You Worry About RealPage, Inc.’s (NASDAQ:RP) ROCE?

Today we'll look at RealPage, Inc. (NASDAQ:RP) and reflect on its potential as an investment. In particular, we'll consider its Return On Capital Employed (ROCE), as that can give us insight into how profitably the company is able to employ capital in its business.
First up, we'll look at what ROCE is and how we calculate it. Second, we'll look at its ROCE compared to similar companies. Last but not least, we'll look at what impact its current liabilities have on its ROCE.
What is Return On Capital Employed (ROCE)?
ROCE is a measure of a company's yearly pre-tax profit (its return), relative to the capital employed in the business. All else being equal, a better business will have a higher ROCE. In brief, it is a useful tool, but it is not without drawbacks. Renowned investment researcher Michael Mauboussin has suggested that a high ROCE can indicate that 'one dollar invested in the company generates value of more than one dollar'.
So, How Do We Calculate ROCE?
The formula for calculating the return on capital employed is:
Return on Capital Employed = Earnings Before Interest and Tax (EBIT) ÷ (Total Assets - Current Liabilities)
Or for RealPage:
0.041 = US$99m ÷ (US$3.0b - US$525m) (Based on the trailing twelve months to December 2019.)
Therefore, RealPage has an ROCE of 4.1%.
View our latest analysis for RealPage
Is RealPage's ROCE Good?
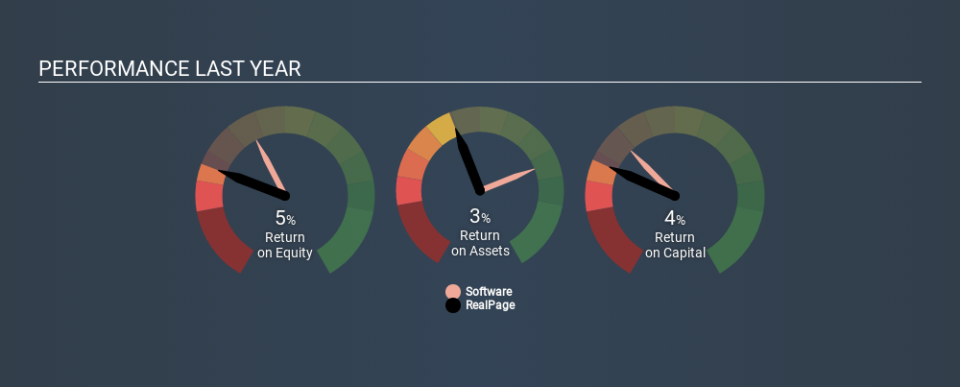
ROCE can be useful when making comparisons, such as between similar companies. Using our data, RealPage's ROCE appears to be significantly below the 9.9% average in the Software industry. This could be seen as a negative, as it suggests some competitors may be employing their capital more efficiently. Regardless of how RealPage stacks up against its industry, its ROCE in absolute terms is quite low (especially compared to a bank account). It is likely that there are more attractive prospects out there.
RealPage's current ROCE of 4.1% is lower than its ROCE in the past, which was 6.7%, 3 years ago. This makes us wonder if the business is facing new challenges. The image below shows how RealPage's ROCE compares to its industry, and you can click it to see more detail on its past growth.
When considering ROCE, bear in mind that it reflects the past and does not necessarily predict the future. ROCE can be misleading for companies in cyclical industries, with returns looking impressive during the boom times, but very weak during the busts. This is because ROCE only looks at one year, instead of considering returns across a whole cycle. Future performance is what matters, and you can see analyst predictions in our free report on analyst forecasts for the company.
How RealPage's Current Liabilities Impact Its ROCE
Short term (or current) liabilities, are things like supplier invoices, overdrafts, or tax bills that need to be paid within 12 months. The ROCE equation subtracts current liabilities from capital employed, so a company with a lot of current liabilities appears to have less capital employed, and a higher ROCE than otherwise. To check the impact of this, we calculate if a company has high current liabilities relative to its total assets.
RealPage has current liabilities of US$525m and total assets of US$3.0b. As a result, its current liabilities are equal to approximately 18% of its total assets. This is not a high level of current liabilities, which would not boost the ROCE by much.
The Bottom Line On RealPage's ROCE
That's not a bad thing, however RealPage has a weak ROCE and may not be an attractive investment. Of course, you might find a fantastic investment by looking at a few good candidates. So take a peek at this free list of companies with modest (or no) debt, trading on a P/E below 20.
If you like to buy stocks alongside management, then you might just love this free list of companies. (Hint: insiders have been buying them).
If you spot an error that warrants correction, please contact the editor at editorial-team@simplywallst.com. This article by Simply Wall St is general in nature. It does not constitute a recommendation to buy or sell any stock, and does not take account of your objectives, or your financial situation. Simply Wall St has no position in the stocks mentioned.
We aim to bring you long-term focused research analysis driven by fundamental data. Note that our analysis may not factor in the latest price-sensitive company announcements or qualitative material. Thank you for reading.
