Should You Worry About The TESSCO Technologies Incorporated’s (NASDAQ:TESS) Shareholder Register?

Every investor in TESSCO Technologies Incorporated (NASDAQ:TESS) should be aware of the most powerful shareholder groups. Large companies usually have institutions as shareholders, and we usually see insiders owning shares in smaller companies. I quite like to see at least a little bit of insider ownership. As Charlie Munger said ‘Show me the incentive and I will show you the outcome.’
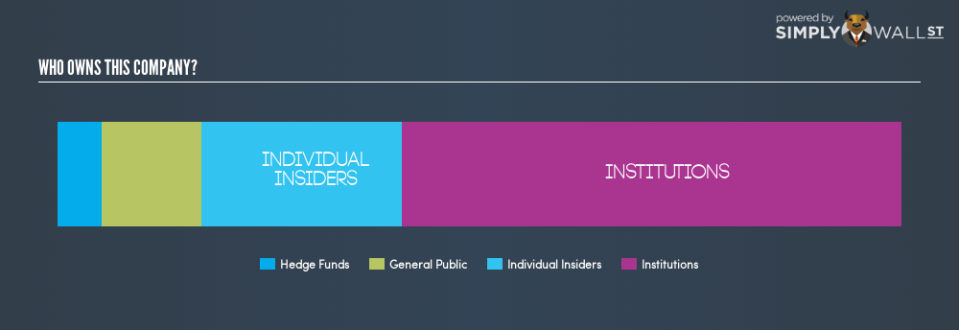
TESSCO Technologies is not a large company by global standards. It has a market capitalization of US$149.2m, which means it wouldn’t have the attention of many institutional investors. In the chart below below, we can see that institutions are noticeable on the share registry. Let’s delve deeper into each type of owner, to discover more about TESS.
Check out our latest analysis for TESSCO Technologies
What Does The Institutional Ownership Tell Us About TESSCO Technologies?
Institutional investors commonly compare their own returns to the returns of a commonly followed index. So they generally do consider buying larger companies that are included in the relevant benchmark index.
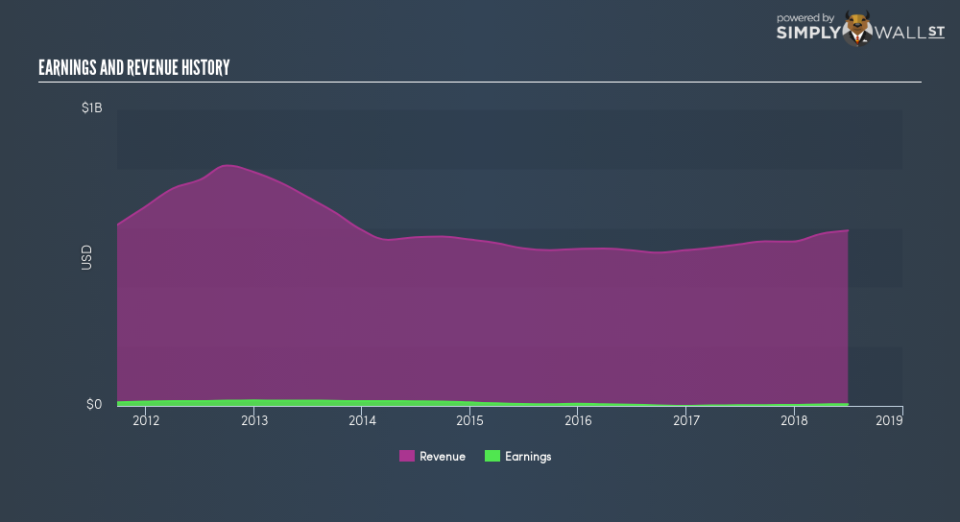
We can see that TESSCO Technologies does have institutional investors; and they hold 59.1% of the stock. This implies the analysts working for those institutions have looked at the stock and they like it. But just like anyone else, they could be wrong. When multiple institutions own a stock, there’s always a risk that they are in a ‘crowded trade’. When such a trade goes wrong, multiple parties may compete to sell stock fast. This risk is higher in a company without a history of growth. You can see TESSCO Technologies’s historic earnings and revenue, below, but keep in mind there’s always more to the story.
Investors should note that institutions actually own more than half the company, so they can collectively wield significant power. It would appear that 5.3% of TESSCO Technologies shares are controlled by hedge funds. That worth noting, since hedge funds are often quite active investors, who may try to influence management. Many want to see value creation (and a higher share price) in the short term or medium term. Our information suggests that there isn’t any analyst coverage of the stock, so it is probably little known.
Insider Ownership Of TESSCO Technologies
The definition of company insiders can be subjective, and does vary between jurisdictions. Our data reflects individual insiders, capturing board members at the very least. Company management run the business, but the CEO will answer to the board, even if he or she is a member of it.
Insider ownership is positive when it signals leadership are thinking like the true owners of the company. However, high insider ownership can also give immense power to a small group within the company. This can be negative in some circumstances. It seems insiders own a significant proportion of TESSCO Technologies Incorporated. Insiders own US$35.4m worth of shares in the US$149.2m company. It is great to see insiders so invested in the business. It might be worth checking if those insiders have been buying recently.
General Public Ownership
With a 11.8% ownership, the general public have some degree of sway over TESS. This size of ownership, while considerable, may not be enough to change company policy if the decision is not in sync with other large shareholders.
Next Steps:
I find it very interesting to look at who exactly owns a company. But to truly gain insight, we need to consider other information, too.
Many find it useful to take an in depth look at how a company has performed in the past. You can access this detailed graph of past earnings, revenue and cash flow .
Of course this may not be the best stock to buy. Therefore, you may wish to see our free collection of interesting prospects boasting favorable financials.
NB: Figures in this article are calculated using data from the last twelve months, which refer to the 12-month period ending on the last date of the month the financial statement is dated. This may not be consistent with full year annual report figures.
To help readers see past the short term volatility of the financial market, we aim to bring you a long-term focused research analysis purely driven by fundamental data. Note that our analysis does not factor in the latest price-sensitive company announcements.
The author is an independent contributor and at the time of publication had no position in the stocks mentioned. For errors that warrant correction please contact the editor at editorial-team@simplywallst.com.
