Should We Worry About Wallenstam AB (publ)'s (STO:WALL B) P/E Ratio?

This article is written for those who want to get better at using price to earnings ratios (P/E ratios). We'll look at Wallenstam AB (publ)'s (STO:WALL B) P/E ratio and reflect on what it tells us about the company's share price. Wallenstam has a price to earnings ratio of 17.77, based on the last twelve months. In other words, at today's prices, investors are paying SEK17.77 for every SEK1 in prior year profit.
See our latest analysis for Wallenstam
How Do I Calculate Wallenstam's Price To Earnings Ratio?
The formula for price to earnings is:
Price to Earnings Ratio = Share Price ÷ Earnings per Share (EPS)
Or for Wallenstam:
P/E of 17.77 = SEK124.70 ÷ SEK7.02 (Based on the trailing twelve months to September 2019.)
Is A High P/E Ratio Good?
A higher P/E ratio means that buyers have to pay a higher price for each SEK1 the company has earned over the last year. That isn't a good or a bad thing on its own, but a high P/E means that buyers have a higher opinion of the business's prospects, relative to stocks with a lower P/E.
How Does Wallenstam's P/E Ratio Compare To Its Peers?
The P/E ratio essentially measures market expectations of a company. You can see in the image below that the average P/E (12.1) for companies in the real estate industry is lower than Wallenstam's P/E.
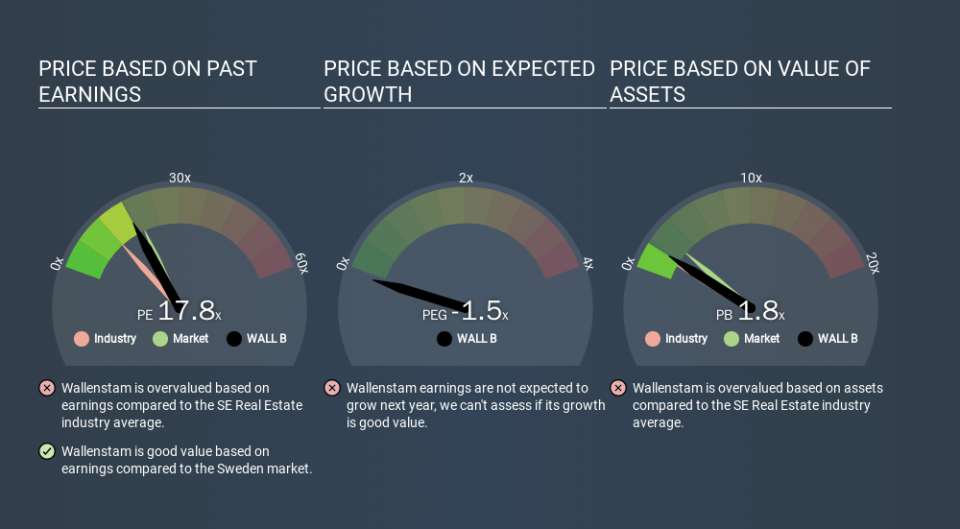
That means that the market expects Wallenstam will outperform other companies in its industry. Shareholders are clearly optimistic, but the future is always uncertain. So investors should always consider the P/E ratio alongside other factors, such as whether company directors have been buying shares.
How Growth Rates Impact P/E Ratios
Generally speaking the rate of earnings growth has a profound impact on a company's P/E multiple. Earnings growth means that in the future the 'E' will be higher. That means unless the share price increases, the P/E will reduce in a few years. A lower P/E should indicate the stock is cheap relative to others -- and that may attract buyers.
Wallenstam shrunk earnings per share by 5.4% last year. But it has grown its earnings per share by 34% per year over the last five years.
Don't Forget: The P/E Does Not Account For Debt or Bank Deposits
One drawback of using a P/E ratio is that it considers market capitalization, but not the balance sheet. So it won't reflect the advantage of cash, or disadvantage of debt. The exact same company would hypothetically deserve a higher P/E ratio if it had a strong balance sheet, than if it had a weak one with lots of debt, because a cashed up company can spend on growth.
Such expenditure might be good or bad, in the long term, but the point here is that the balance sheet is not reflected by this ratio.
So What Does Wallenstam's Balance Sheet Tell Us?
Wallenstam's net debt is 58% of its market cap. If you want to compare its P/E ratio to other companies, you should absolutely keep in mind it has significant borrowings.
The Verdict On Wallenstam's P/E Ratio
Wallenstam has a P/E of 17.8. That's below the average in the SE market, which is 19.6. When you consider that the company has significant debt, and didn't grow EPS last year, it isn't surprising that the market has muted expectations.
Investors should be looking to buy stocks that the market is wrong about. If the reality for a company is not as bad as the P/E ratio indicates, then the share price should increase as the market realizes this. So this free visual report on analyst forecasts could hold the key to an excellent investment decision.
Of course you might be able to find a better stock than Wallenstam. So you may wish to see this free collection of other companies that have grown earnings strongly.
If you spot an error that warrants correction, please contact the editor at editorial-team@simplywallst.com. This article by Simply Wall St is general in nature. It does not constitute a recommendation to buy or sell any stock, and does not take account of your objectives, or your financial situation. Simply Wall St has no position in the stocks mentioned.
We aim to bring you long-term focused research analysis driven by fundamental data. Note that our analysis may not factor in the latest price-sensitive company announcements or qualitative material. Thank you for reading.
