Wynn Resorts (WYNN) Q3 Earnings & Revenues Beat Estimates
Wynn Resorts, Limited WYNN reported impressive third-quarter 2023 results, with earnings and revenues surpassing the Zacks Consensus Estimate. Also, the top and bottom lines grew year over year.
The company’s results reflect solid performance growth in its Macau and North American properties. The consistent growth trend in mass gaming, luxury retail and hotel businesses in Macau portrayed exceptional post-Covid recovery during the quarter. It is also optimistic about its new opening at UAE, Wynn Al Marjan Island, which is currently under construction.
Q3 Earnings & Revenues
During the quarter, the company reported adjusted earnings of 99 cents per share, beating the Zacks Consensus Estimate of earnings of 79 cents per share by 25.3%. In the prior-year quarter, the company reported an adjusted loss of $1.20 per share.
Wynn Resorts, Limited Price, Consensus and EPS Surprise
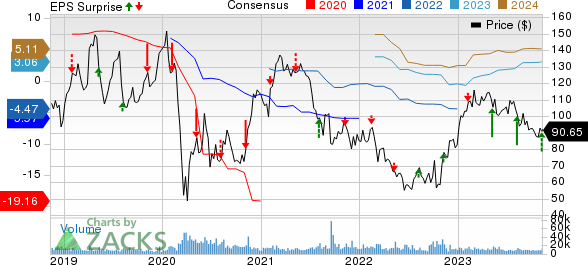
Wynn Resorts, Limited price-consensus-eps-surprise-chart | Wynn Resorts, Limited Quote
Quarterly revenues of $1.67 billion surpassed the consensus mark of $1.58 billion by 6%. Also, the top line increased 87.9% on a year-over-year basis. The upside was mainly attributed to performance growth in Wynn Palace and Wynn Macau, resulting from an increase in gaming volumes, hotel occupancy and covers at restaurants.
Wynn Palace Operations
During the third quarter of 2023, Wynn Palace’s operating revenues were $524.8 million compared with $75.2 million reported in the prior-year quarter. The reported value can be compared with our model’s projection of $357.7 million, or 375.4% year-over-year growth, which is comparatively on the lower side.
Casino revenues in the reported quarter totaled $418 million compared with $45.4 million reported in the prior-year quarter. Rooms, and food and beverage revenues surged a whopping 678.7% and 357.7% year over year to $54.3 million and $26.2 million, respectively. During the quarter under review, entertainment, retail and other revenues increased 52.5% year over year to $26.2 million.
In the VIP segment, table games turnover was $2.87 billion, up 910.2% year over year. VIP table games win (loss) rate (based on turnover) was 3.42% compared with 3.27% reported in the prior-year quarter. Table drop in the mass market segment was $1.73 billion compared with $197.1 million reported in the prior-year quarter. Table games wins in mass market operations amounted to $402.3 million compared with $42.4 million reported in the prior-year quarter.
During the reported quarter, revenue per available room, or RevPAR, increased 707.3% year over year to $331. Occupancy levels in the segment were 96.9% compared with 28.1% reported in the prior-year quarter. The average daily rate (ADR) during the quarter was $342, up 135.9% on a year-over-year basis.
Wynn Macau Operations
During the third quarter, Wynn Macau’s operating revenues amounted to $295 million compared with $40.4 million reported in the prior-year quarter. For this business operation, we projected year-over-year growth of 339.1% to $177.2 million.
Casino revenues in the reported quarter were $230.3 million, up 908.6% year over year. Rooms, and entertainment, and retail and other revenues grew 620.7% and 66.2% year over year to $31.7 million and $14.8 million, respectively. During the quarter, food and beverage revenues increased 329.2% year over year to $18.3 million.
Table games turnover in the VIP segment increased 680.1% year over year to $1.19 billion. The VIP table games win rate (based on turnover) was 3.52%, up from 1.56% reported in the prior-year quarter.
Table drop in the mass market segment was $1.38 billion compared with $167.5 million reported in the prior-year quarter. Table games win in the mass market category was $228.3 million compared with $22.2 million reported in the prior-year quarter.
During the reported quarter, RevPAR grew 651.2% year over year to $323. Occupancy levels in the segment were 98.7% compared with 31.4% in the prior-year quarter. Furthermore, ADR was $327, up 138.7% year over year.
Las Vegas Operations
During the third quarter, operating revenues from Las Vegas operations were $619 million. The reported value is compared with $544.4 million reported in the year-ago quarter and our quarter’s expectation of $629.8 million or 15.7% year-over-year growth.
Casino revenues increased 25.2% year over year to $168.1 million. Revenues from food and beverage grew 4.8% to $203.1 million. Also, the revenues for rooms as well as entertainment, retail and other increased by 10.1% and 27.7% year over year to $178.5 million and $69.3 million, respectively.
Table games drop was up 6.5% year over year to $607.6 million. Table games wins also increased 33.5% year over year to $157.9 million. During the third quarter, table games win percentage of 26% was above 20.7% reported in the prior-year quarter.
During the quarter under review, RevPAR grew 10.3% year over year to $417. The occupancy rate was 90%, up from 88.8% reported in the prior-year period. ADR was $463, up 8.7% year over year.
Encore Boston Harbor
During the third quarter, operating revenues from Encore Boston Harbor operations amounted to $210.4 million, down from $211.8 million reported in the prior-year quarter. The reported value is comparatively lower than our projection of 6.8% year-over-year growth to $226.1 million.
Casino revenues declined 0.9% year over year to $156 million. Revenues from rooms, as well as entertainment, retail and other increased 4.7% and 0.3% year over year to $24.8 million and $9.7 million, respectively. However, revenues from food and beverage declined 5.5% year over year to $19.9%.
During the quarter, table games win percentage of 20.8% was below 21.1% reported in the prior-year quarter.
During the reported quarter, RevPAR increased 4.9% year over year to $405. The occupancy rate was 96%, down from 97% reported in the prior-year quarter. ADR was $421, up 5.8% year over year.
Operating Performance
During the third quarter of 2023, adjusted property EBITDAR was $530.4 million compared with $173.5 million reported in the prior-year quarter.
In the quarter under review, adjusted property EBITDAR from Wynn Macau totaled $77.9 million against ($43.8) million reported in the prior-year quarter. Adjusted property EBITDAR from Las Vegas operations was $219.7 million compared with $195.8 million reported in the year-ago quarter. Adjusted property EBITDAR from Encore Boston Harbor was $60.5 million compared with $61.1 million reported in the prior-year quarter.
Cash Position
As of Sep 30, 2023, Wynn Resorts’ cash and cash equivalents totaled $2.79 billion, down from $3.65 billion reported as of 2022 end.
Total current and outstanding debt at the end of third-quarter 2023 amounted to $11.79 billion. The figure included $2.25 billion of Wynn Las Vegas-related debt, $6.79 billion of Macau debt, $2.14 billion of Wynn Resorts Finance debt and $613.9 million of debt held by the retail joint venture, which the company consolidated.
Zacks Rank
Wynn Resorts currently carries a Zacks Rank #3 (Hold). You can see the complete list of today’s Zacks #1 Rank (Strong Buy) stocks here.
Recent Consumer Discretionary Releases
SeaWorld Entertainment, Inc. SEAS reported third-quarter 2023 results wherein earnings met the Zacks Consensus Estimate while revenues topped the same. On the other hand, both metrics declined on a year-over-year basis.
The company’s results were affected by adverse weather impacts during its peak operating season across most of its markets, reflecting lower attendance of guests. That said, the company intends to focus on its strategic growth initiatives related to hotels, international expansion and digital activities accompanied by increasing its in-park product offerings and cost management plans. These initiatives are quite likely to aid it in growing its revenues and profitability in the upcoming period.
Choice Hotels International, Inc. CHH delivered mixed third-quarter 2023 results, with earnings missing the Zacks Consensus Estimate and revenues beating the same. Also, the top and bottom lines increased on a year-over-year basis.
The year-over-year growth is attributable to the company’s top-tier business delivery engine, synergies through the successful integration of Radisson Americas and organic growth of its brand portfolio, focused on hotels that generate higher royalties per unit. The company also aims to remain focused on its robust organic earnings growth strategy and pursues inorganic growth to drive long-term shareholder value.
Hyatt Hotels Corporation H delivered third-quarter 2023 results, wherein earnings surpassed the Zacks Consensus Estimate, while revenues missed the same. However, metrics increased on a year-over-year basis.
Hyatt’s quarterly results reflected year-over-year growth in comparable system-wide RevPAR, driven by an increase in occupancy and average daily rate. This uptrend is primarily driven by robust global travel demand, especially among leisure guests and group customers. Also, net room growth fueled solid fee generation, which the company expects to continue in the upcoming period, given the positive trends. However, increased costs and expenses, foreign currency risks and the ongoing macroeconomic uncertainties partially offset the aforementioned tailwinds.
Want the latest recommendations from Zacks Investment Research? Today, you can download 7 Best Stocks for the Next 30 Days. Click to get this free report
Hyatt Hotels Corporation (H) : Free Stock Analysis Report
Wynn Resorts, Limited (WYNN) : Free Stock Analysis Report
Choice Hotels International, Inc. (CHH) : Free Stock Analysis Report
SeaWorld Entertainment, Inc. (SEAS) : Free Stock Analysis Report
